
A reason to always use MTBF
One the many rationales for the use of MTBF, is simply that we have always used MTBF. This helps those using this logic to avoid thinking. Business today is full of decision making and decision makers avoid a few just to survive.
With any measure it is only a representation of what is really happening. For reliability we want to estimate and track field failure rates, for example. MTBF is one way (some say) do accomplish this measure. To be clear, if I tally up the total hours of operation of units being used by customers, and divide by the number of failures, the result is commonly called MTBF (or MTTF, or one of many variants). The inverse is our field failure rate, or an estimate of that measure.
A simple example
Let try a very simple example. Let’s say we are shipping 100 units on January 1st. And let’s say the failures are very well behaved with one failure at 2 months, one at 4 month, and so on at 6, 8 and 10 months for a total of 5 failures from the a single shipment of 100 units the first month. As units failed are removed from service. So each of the 95 units operated for approximately 8,760 hours for a total of 832,200 hours . The failed units operated for a total of 30 months, or 730 * 30 = 21,900 hours. Thus MTTF is (832,200 + 21,900 ) / 5 = 170,820 hours. Another way to express this same result is to consider that 5 of the 100 failed, thus we can say we have a 5% failure rate over the first year, or 95% reliability over first year. Let’s alter this simple example very slightly. Let’s move the failures at months 2 and 4 to months 8 and 10. Months 8 and 10 now have two failures, month 6 still only has one. The MTTF increases slightly given the additional 12 month of operation to 172,572 hours MTTF. The simple tally of failures over time we find the same annual failure rate. The MTTF changes slightly and the failure rate and reliability values at one year remain the same.
Prediction for Next Year
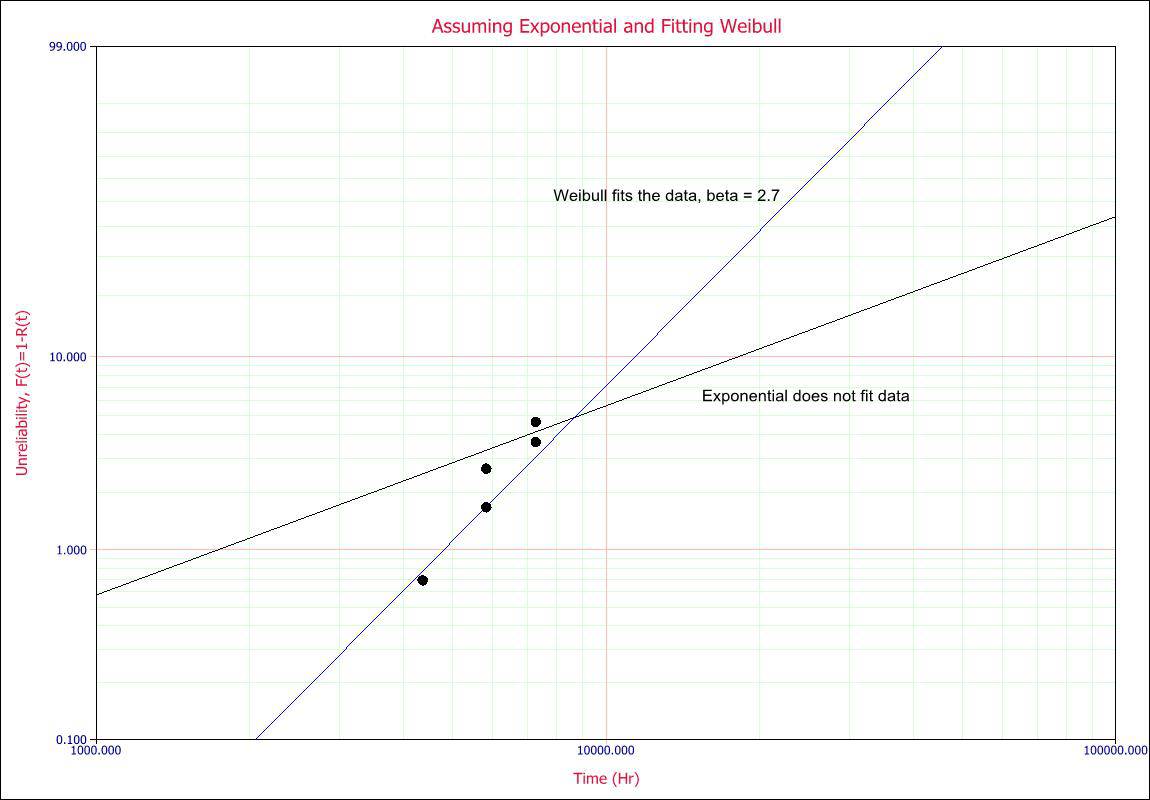
Now’s let say we want to predict how many failures to expect next year. For the simple example with relatively steady arrival of failures we would expect another 5 failures, or a 90% reliability at two years. The MTTF would remain the same. For the second example with a couple of failures moved to later in the first year, we would again expect about 90% reliability and an additional 5 failures if using MTTF. Does this make sense as it appears there is an increasing failure rate between the year halves. A simple plot shows the Exponential does not fit the data very well. Although a Weibull appears to fit the data points a lot better.
 So, we are trying to predict the number of failures (or reliability) out to 2 years these two fits will provide different results. The exponential estimates a reliability of 90% at 2 years. The Weibull fit estimates a 71% reliability at 2 years. With the Weibull fit we would predict an additional 24 failures would arrive. This is almost a 5x difference in expected failures using the same data. Even in this very simple example, you can see the impact breaking away from MTBF may have on decisions for staffing call or repair centers, product improvements, stocking of replacements or spares, etc. Change is good when it permit better decisions. Plot the data and use the appropriate modeling rather than rely on MTBF as the only approach, just because that is what you always have done.
Leave a Reply