True or False? RCM is only about formulating a Proactive Maintenance Plan.
/moreYour Reliability Engineering Professional Development Site
A listing in reverse chronological order of these article series:

Assets typically age over time, leading to degraded performance and loss of function. Asset life models are built in order to predict future degradation patterns. Those models are based on asset degradation variables such as time or usage. Those variables could be for example, time between failures or distance covered between failures. Many assets have more than one degradation variable. In this case, it is important to define which of the multiple variables is the dominant one and will subsequently provide the Reliability Engineer with the most precise life model.
Reliability is a probability. Specifically, the probability that a system will perform its intended function within a specified mission time and under specific process conditions. Therefore, most reliability calculations incorporate a time element as a degradation variable. Generally, when building life models, we default to using calendar time as it is more straightforward. We have had tools to easily measure elapsed calendar time for centuries now. [Read more…]

The falling cost of sensors for Industrial Equipment & the popularity of AI-based solutions means that Organizational teams are defaulting to using this strategy on all their Equipment, regardless of its criticality or other effectiveness. This is a strategic error.
[Read more…]
You must select OHS risk management mitigations appropriate to a job safety hazard using a formal method that delivers safe work practices.
Each task safety control will need to be developed, assessed for suitability, and recorded so it’s clear what the plan is, and how it is to be done.
In the end, there is a practically designed, completely resourced, fully scheduled, and totally sure safe work practice procedure approved for use.
[Read more…]
The concept of Reliability Block Diagrams (RBD) is also known as Reliability Modeling or Reliability, Availability, Maintainability (RAM) analysis. With RAM models, the interaction of large, complex, and multi-layered systems can be analyzed using Monte Carlo simulation methods. This help quantify the output of the entire system with greater accuracy than other estimating tools or methods. [Read more…]
In the previous article, P-F Curve was used to understand the Remaining useful life (RUL) of an asset. RUL can be estimated at any time during the asset’s life, but it’s opportune to calculate RUL at the time ‘t’ when the asset shows signs of an impending failure. In the P-F Curve terminology the point at which the asset shows signs of failure is called the Potential Failure Point (Pf), which can also be stated as the time of anomalous behavior. The exercise of detecting anomalous behavior is called “Anomaly Detection (AD)”.
[Read more…]
When equipment working parts are operated within their precision quality standard zones, world-class reliability is guaranteed.
The figures below demonstrates the importance of setting precision quality standards to achieve outstanding equipment reliability. It comes from a conference presentation on the production equipment reliability improvement in a steel mill in Australia.
[Read more…]
Humans are often so focused on the complex, that the simple gets overlooked. Even as technology and our equipment gets more complex, we need to be firmly rooted in the basics of maintenance and reliability.
That’s one reasons why the first step of RCM is so important.
[Read more…]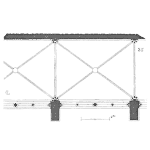
Recently, there has been an influx of Industry 4.0 companies promising their product/application would help predict the Remaining Useful Life (RUL) of a physical asset. Each uses a mix of machine learning algorithms to estimate the RUL based on the data available. This is their value proposition. But what is this ‘life’?
[Read more…]
This is an example of the value of identifying the variability in your business processes and removing them before spending money on new capital works. A simple production rate distribution bar chart shows you whether you have a “hidden factory” and how big it is.
[Read more…]
The mining industry in Australia has for some time been plagued by high turnover in its skilled maintenance workforce. The tough lifestyle and remote/regional locations are some of the main contributing causes, and have been for years, however other industries of employment offering competitive wages and a better lifestyle have in the recent years pulled the workforce from mining, leaving a void of labor numbers behind that have proved difficult to fill.
The common query, “How do I keep equipment reliability up, even with high turnover?” prompts a standardized response from most maintenance professionals – proceduralize the maintenance system to reduce variability and maintain consistent output. However, while this approach bears truth, it overlooks a substantial aspect…
[Read more…]
Robert G. Albion was a notable historian of maritime affairs. He taught at Princeton and Harvard, and was one of the US Navy’s chief historians during World War II. In one of his books, Albion examined how timber management in Britain affected naval shipbuilding and maintenance policies.
In the late 1700s, the British Empire was more dependent on the navy for power projection, home defense, and security of maritime trade. In the age of sail, the average ship life was between 10 and 20 years. In the 17th century, British naval ships lasted 25-30 years. Albion found their average service life to be only 13 years in 1771. By 1792, service life fell to 12 years. In the Napoleonic period, the lifespan fell to only 8 years.
“The ‘life’ or duration of a ship was reckoned from the date of her launching to the time when her condition necessitated repairs as costly as the construction of a new ship.” The British determined service life by a basic level of repair analysis.

In the Reliability and Maintenance world, we often refer to what is known as the “bathtub” curve and ask the question: “What is the bathtub curve for this equipment?” The name “bathtub” comes from the equipment failure rate curve resembling a sanitary bathtub’s longitudinal section. In reality, it is rarely symmetrical and looks more like a distorted “u” or “v” shaped figure. The bathtub curve can be useful in various circumstances and help an operator better manage their assets over time. However, it is important to understand where it comes from and what it means so we can avoid misusing or misinterpreting it.
[Read more…]
Proponents of the Continuous Improvement method often quote the dictum ‘what gets Measured, gets Improved’. I’d like to modify it by adding ‘what gets Monitored…’ to its beginning. Here I’m referring to the Monitoring of the physical assets in their usage conditions and being Measured & Improved for their Reliability (Availability %, Cost $, MTBF, etc.) and Safety metrics.
[Read more…]
Use Ben Franklin’s Distribution Curves for Performance Monitoring and Fast Improvement. Ben Franklin used statistical analysis to change his life. By measuring his ‘gaining of Virtue’ he quickly became rich and famous. You can change your business performance in the same way. But be cautious – Franklin’s method changed his behaviour forever.
[Read more…]