
This video provides the live audio for our Decision Making with Data presentation. The audio had issues at the beginning but gets better. [Read more…]
Your Reliability Engineering Professional Development Site
A listing in reverse chronological order of articles by:
This video provides the live audio for our Decision Making with Data presentation. The audio had issues at the beginning but gets better. [Read more…]

You have a process that is not capable because sample measurements or SPC data indicate that some characteristics have too much variability. The calculated Cpk’s are too small. What do you do?
Assuming the data is correct, a course of action is to review the assumption is that the measurements are normally distributed. For most situations, this is a reasonable assumption, but other statistical distributions may provide a better description of the data variation.
Failure modes and their causes can be detected in service, like tire pressure monitors on your vehicle. Is that what is assessed in the Detection column of the FMEA? This article discusses detection risk, including examples, and answers this question.
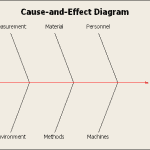
In the prior article, Process Capability IV, vehicle wheel toe alignment showed excessive variation. Because the vehicle assembly process is very long and involves many steps, the toe alignment problem required brainstorm which serial production steps, factors, and levels could be responsible for the variation. The most likely process steps were examined and the problem area identified as a wheel alignment machine that needed maintenance and calibration.

Another name for this could be – Creativity in Design of Experiments. But our title seems to fit better. With DOE being a “structured” approach, how can it possibly provide creativity? In our New Product Development work, we have used DOE to experience creative breakthroughs. [Read more…]
This post provides a list of my process capability articles, a short description and a link. The goal is to make it easy for the reader to locate any of the articles. It is recommended to read these articles in the order presented. This post will be updated when additional posts are written on the Process Capability topic.

This post provides a list of my telematics analytics articles, a short description and a link. The goal is to make it easy for the reader to locate any of the articles. It is recommended to read these articles in the order presented. This post will be updated when additional posts are written on this topic.

With today’s software and problem solving methodologies, there is no reason to be teaching or using Taguchi methods. They have a range of limitations and assumptions, and better options exist and are easy to use. Watch this video to learn more! Avoid falling for the sales pitch for yesterdays tools. No reason to limit your options and your learning. [Read more…]
Ponder this question: Let’s say you are an OEM and assemble parts made by various suppliers. When performing your Process FMEA, do you consider special characteristics for components in your Process FMEA? This question is discussed and answered in this edition of FMEA Q and A.
“The key to wisdom is this – constant and frequent questioning, for by doubting we are led to question, by questioning we arrive at the truth.”
Peter Abelard
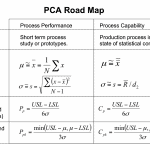
In the article Process Capability I – Overview and Indices, the main process performance indices were defined. In the article Process Capability Analysis II – Estimating Percent Defective, ways to calculate the percent defective were introduced.
Next, a way to estimate estimate the percent defective was discussed in Process Capability III – Cp vs Percent Defective. The data showed the process had a Cp ~0.46, so even if centered, a high percentage of parts would be non-conforming! In industry, it is common to see a Cp of about 1. The paradigm is that if the process range is just contained within the tolerance range, it is satisfactory. Such processes are marginally capable. A process mean shift away from the target or an increase in variation significantly increases the number of non-conforming parts. Process Capability needs to be increased. At a minimum, Cp should be greater than 1.33, but larger is better.
There are two approaches to improving process capability. One is to center the process and the other is to reduce variation. Both need to be accomplished.

What is TRIZ and could it help you? We take a brief look and provide the basics of what it covers. Innovation is going to be key in the next several years as companies grow and emerge. [Read more…]

Innovation is vital for company and economic growth. What is it? How can you achieve it? We begin to explore this with you.
Agile has gained popularity as a software development tool, however it has also been implemented in hardware situations. What is unique about it? What are the core principles? Can I use those ideas with my existing methods? This video answers those and many more questions. [Read more…]

In the article Process Capability I – Overview and Indices, the main process performance indices were defined. In the article Process Capability Analysis II – Estimating Percent Defective, ways to calculate the percent defective were introduced.
In this article, the mathematical connection between the Cp index and percent defectives is made.

A key characteristic of Design of Experiments is the resolution. This is a concept that is often misunderstood, or not understood at all. We have attempted to provide a quick discussion so a user can determine if they are at risk. [Read more…]