Fatigue regulations and guidelines have been long established in aviation, transportation and the nuclear industries (just to name a few). The science is solid supporting the correlation between human fatigue, and poor decision-making/poor responsiveness.
So why aren’t such fatigue regulations required in healthcare as a matter of standard like in other industries? Is there something different about the physiology and/or anatomy of a healthcare worker versus a pilot, truck/bus driver or nuclear operator? [Read more…]


 Think about your maintenance program. How often are your PMs scheduled? How were those frequencies established? If you are in the majority, the chances are that the frequencies were either established from the OEM manual, or by someone in the department without data.
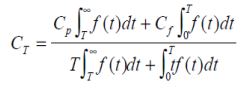 This formula is used to establish the economic life of the component, balancing the cost of the downtime vs. the cost of the replacement.