What you will learn from this article.
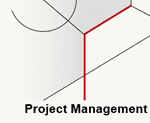
- How forces are distributed through an object.
- Force diagrams are used to represent forces on an object.
- Position and direction of a force determines the type of stress.
- How to redistribute force in a structure.
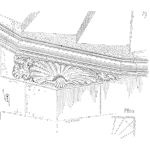
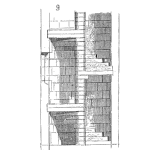
Why don’t you fall to the ground when you sit in a chair? Why doesn’t the roof fall in on top of you? We don’t expect these sorts of things to happen. But at times chairs fail and people fall to the ground and at times roofs fall on people. When structures are put under sufficient stress they will fail. [Read more…]