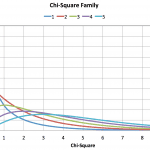
Telematics data presents the opportunity to characterize the vehicle lifetime usage. This information is used to validate development and testing targets. Because there can be bad or missing data, it needs to be reviewed prior to analysis to have confidence in the analysis. [Read more…]
A Primer on Probability Plots
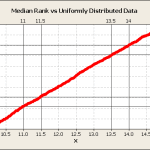
In my prior article, “A Primer on Probability Distributions”, the usage of different types of histograms to display data was discussed. The histogram would acquire a bell shape if the data were normally distributed. The main limitation of the histogram approach is that the shape of the histogram can change radically with the selection of the bins used. Instead, a probability plot could be used.
This article discussed probability plots. They are extremely useful for the analysis of big and small data sets.
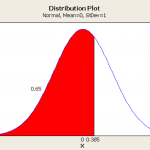
Estimating the Normal Distribution Parameters and Tolerance Limits
Frequently, data collection is the most time consuming and expensive part of a project. Consequently, people work with small sample data. There is too little data to plot a histogram, so the analysis assumes the underlying population is normally distributed.
A frequent error is to assume the sample average and standard deviation are the population normal mean and standard deviation. When small sample sizes are being analyzed, these assumptions lead to estimation errors.
Methods to make better estimates are discussed in this article. [Read more…]
A Primer on Probability Distributions
The most common types of engineering data are measurements. There can be a few, thousands, or millions of data points to analyze. Without analytic tools, one can get lost in the data.
This article presents
- Dotplots
- Data if frequently clustered about a central value and displays variation.
- Frequency histograms
- Distribution characteristics
- Normal Distributions
DOE Supports World Class Quality
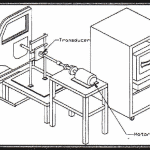
This is an example of a practical DOE that was used in the development of a manual window mechanism for a truck application. A similar process can be used for current mechanical and electrical design and development projects. In this article, you will see that the DOE method:
- is superior to the design-test-fix cycle
- builds knowledge of which factors are important to product performance
- quantifies the effect of a combination of factors
- allows performance prediction
Reliability Test Validation and Product Verification
Working with product engineers to develop a reliability test early in a program can be a satisfying experience. My interactions with the product engineers are the most fruitful when there is mutual respect. I ask the product engineer questions about his goals, the product features, the supplier, and rely on his product expertise. I like to examine prototype parts and review an engineering drawing or the circuit diagrams.
A good example was when a product engineer, let’s call him Jim, approached me to develop a safety switch reliability test.
Is Warranty Big Data?
Vehicle Warranty Big Data
Automobile companies pay dealers to perform vehicle prep and make warranty repairs on customer vehicles. A lot of data is collected thus warranty is considered big data.
Generally, vehicle warranty covers 3 years or 36,000 miles. When a vehicle is serviced, the customer, vehicle, repair, and text data are collected. Claims are entered into a transaction database, may be rejected for a number of reasons, and then resubmitted until resolved. The transaction database covers many model years, millions of vehicles, and a number of warranty claims for each vehicle. As a rough estimate, assuming 10 years, 2 million vehicles/year, and 2 claims for each vehicle, yields 40 million records. The actual number is higher due to the submission, rejections, and resubmission cycle.
A Short Primer on Residual Analysis
How to Do Residual Analysis to Check Your Statistical Models
The analysis of residuals helps to guide the analyst when analyzing data. It provides a way to select the model, analyze the data, develop parameter estimates, and to develop confidence in the results. [Read more…]
Switch Verification
Customer Usage Switch Verification
Here is an example of a common engineering development task. A design engineer needed a life test plan for a switch verification in a safety system. We jointly developed a plan by taking a system view of the component function, considered corporate and regulatory requirements, customized it to the supplier’s test capabilities, executed the plan, and made design changes to remove product defects. [Read more…]
Analysis of Continuous Variables
Telematics data analysis can be used to improve our understanding of how people use their vehicles. It is an objective source to validate product requirements. In cars and trucks, sensor signals are read by electronic modules share the data on a CAN bus. Some signals contain data for continuous variables. Some examples of continuous variables are vehicle speed, engine speed, engine torque, ambient temperatures, in-vehicle temperatures, pressures, voltages, and the battery state of charge. Another name for the continuous variables is parametric data. This CAN data is a rich source of information
Telematics Counting Data Analysis
In my prior article, an overview of vehicle telematics was provided. Telematics data includes time stamped records and fields containing count or parametric data recorded from the vehicle CAN bus. The count data is always a non-negative integer and the parametric data is stored as real numbers, generally in scientific format. This article focuses on the analysis of counting data.
Count data is used to monitor events, i.e., the number of trips, the days of operation, the calendar date, door open/close cycles, the number of engine starts/stops, or other variables. So, if a variable is selected for analysis, how can it be analyzed and a vehicle be characterized? How can fleets be analyzed? Can vehicle usage percentiles be determined?
[Read more…]
Telematics Data Analytics Overview
Product design, development, and reliability engineers need to verify that their product meets specifications, which include dimensional requirements, functional definitions, and life testing. How are the requirements validated?
Telematics data is collected to show how a vehicle has been operated. Fleets and retail data are stored on servers for engineering analysis. This data can be used to set new requirements or validate older requirements.