Accendo Reliability

Your Reliability Engineering Professional Development Site

  • Home
  • About
    • Contributors
  • Reliability.fm
    • Speaking Of Reliability
    • Rooted in Reliability: The Plant Performance Podcast
    • Quality during Design
    • Way of the Quality Warrior
    • Critical Talks
    • Dare to Know
    • Maintenance Disrupted
    • Metal Conversations
    • The Leadership Connection
    • Practical Reliability Podcast
    • Reliability Matters
    • Reliability it Matters
    • Maintenance Mavericks Podcast
    • Women in Maintenance
    • Accendo Reliability Webinar Series
  • Articles
    • CRE Preparation Notes
    • on Leadership & Career
      • Advanced Engineering Culture
      • Engineering Leadership
      • Managing in the 2000s
      • Product Development and Process Improvement
    • on Maintenance Reliability
      • Aasan Asset Management
      • AI & Predictive Maintenance
      • Asset Management in the Mining Industry
      • CMMS and Reliability
      • Conscious Asset
      • EAM & CMMS
      • Everyday RCM
      • History of Maintenance Management
      • Life Cycle Asset Management
      • Maintenance and Reliability
      • Maintenance Management
      • Plant Maintenance
      • Process Plant Reliability Engineering
      • ReliabilityXperience
      • RCM Blitz®
      • Rob’s Reliability Project
      • The Intelligent Transformer Blog
      • The People Side of Maintenance
      • The Reliability Mindset
    • on Product Reliability
      • Accelerated Reliability
      • Achieving the Benefits of Reliability
      • Apex Ridge
      • Metals Engineering and Product Reliability
      • Musings on Reliability and Maintenance Topics
      • Product Validation
      • Reliability Engineering Insights
      • Reliability in Emerging Technology
    • on Risk & Safety
      • CERM® Risk Insights
      • Equipment Risk and Reliability in Downhole Applications
      • Operational Risk Process Safety
    • on Systems Thinking
      • Communicating with FINESSE
      • The RCA
    • on Tools & Techniques
      • Big Data & Analytics
      • Experimental Design for NPD
      • Innovative Thinking in Reliability and Durability
      • Inside and Beyond HALT
      • Inside FMEA
      • Integral Concepts
      • Learning from Failures
      • Progress in Field Reliability?
      • R for Engineering
      • Reliability Engineering Using Python
      • Reliability Reflections
      • Testing 1 2 3
      • The Manufacturing Academy
  • eBooks
  • Resources
    • Accendo Authors
    • FMEA Resources
    • Feed Forward Publications
    • Openings
    • Books
    • Webinars
    • Journals
    • Higher Education
    • Podcasts
  • Courses
    • 14 Ways to Acquire Reliability Engineering Knowledge
    • Reliability Analysis Methods online course
    • Measurement System Assessment
    • SPC-Process Capability Course
    • Design of Experiments
    • Foundations of RCM online course
    • Quality during Design Journey
    • Reliability Engineering Statistics
    • Quality Engineering Statistics
    • An Introduction to Reliability Engineering
    • Reliability Engineering for Heavy Industry
    • An Introduction to Quality Engineering
    • Process Capability Analysis course
    • Root Cause Analysis and the 8D Corrective Action Process course
    • Return on Investment online course
    • CRE Preparation Online Course
    • Quondam Courses
  • Webinars
    • Upcoming Live Events
  • Calendar
    • Call for Papers Listing
    • Upcoming Webinars
    • Webinar Calendar
  • Login
    • Member Home

by Perry Parendo Leave a Comment

The Basis of Design of Experiments is Comparison

The Basis of Design of Experiments is Comparison

A t-test Example

The basis of DOE analysis is comparing two samples. This methodology can be used just as well for changing one variable or more than one variable as in DOEs. Comparison of means is as simple as the t-test.

Some people initially feel intimidated considering the connection of DOE with statistics. Once they understand it in simple terms, the topic comes together for them.

So let’s see if we can accomplish that for you now. 

A t-test Description

First, what is the t-test about? It is used to compare two sample means within a confidence zone. Statistically speaking, it is a test of the Null Hypothesis. It is also known as “Student’s” t distribution. But we are keeping things simple, so think about it as comparing two means.

This can be shown graphically below. The figure on the left represents something that most people would call “the same”. Statistics will put numbers on it, but it should make sense by looking at a picture. The figure on the right shows “different”. Again, I think you’ll agree it is obvious in this case.

Same and Different Distributions

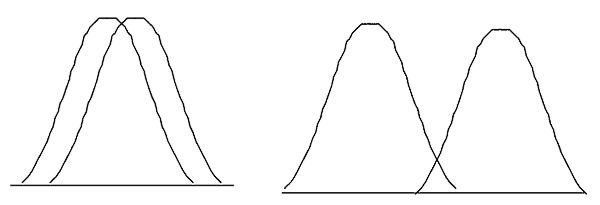
So why does it get complicated when we add numbers to it? I think it is only because we lose the fact there is a graph behind it. The numbers by themselves don’t mean much if you forget the source of the number. Of course, reality may have different standard deviations – but that can easily be accounted for mathematically. So let’s review the method of calculation.

The “t-score” is arrived at as follows:

t-score = (mean1 – mean2) / (standard deviation / n1/2)

Where n is the sample size.

What does this do for us? The value of t creates a confidence zone for the comparison of the means. Many people use a 5% value as a typical rule of thumb for α (alpha) which implies a 95% confidence for inferring the means are the same.

A DOE t-test Example

Most people have performed this calculation, but hopefully it means a little bit more now. Let’s take a look at some data. This is a DOE t-test, which is somewhat simplified.

We will use the following two data sets:

Low level for factor A (Alow): 67, 61, 59, 52
This provides a 59.75 average (Alowavg) and a 6.18 standard deviation s(Alow).

High level for factor A (Ahigh): 79, 75, 90, 87
This provides a 82.75 average (Ahighavg) and a 6.95 standard deviation s(Ahigh).

We need to account for the difference in standard deviation between the two populations. Statistically, this is called a “pooled standard deviation”. For us, let’s just say we are computing a weighted average of the variance (the standard deviation squared). Because we have the same number of samples for each level of factor A, this becomes a simple equation.

spooled2 = ( s(Alow)2 + s(Ahigh)2 ) / 2

Now, we just need to plug in the remaining data from the problem. Again, this is a simplified equation for a DOE situation.

t-score = (Ahighavg – Alowavg) / (spooled / (n/4)1/2)
= (82.75 – 59.75) / (6.58 / (8/4)1/2) = 4.94

In this case, we have 6 Degrees of Freedom (DOF) knowing that DOF = n – 2 for a DOE. Taking this t-score to a t-table (see the partial t-table below), we interpolate to find the probability value also called a p-value.

Partial t-table

Probability (two tailed)
DOF 0.005 0.001
6 4.317 5.959

This t-score provides roughly an α = 0.003. Because alpha is less than 0.05, we can assume these means are different. Now, let’s think about it again. We went through this long process to answer the question “is 82.75 different than 59.75”. Are we really surprised, looking at the raw data, that we say they are different? I don’t think so.

Statistically, we would say there is a low probability they are equal means. Thus the two means are considered to be different.

Summary

In conclusion, all we are trying to do with a t-test is compare two means – are they the same, or different. In DOE, we are hoping to find different means because those things will change (improve) our product or process performance if we set them to the proper level.

Current Contact Information

• PerryParendo
• 651-230-3861
• Perry@PerrysSolutions.com
• www.PerrysSolutions.com

Filed Under: Articles, Experimental Design for NPD, on Tools & Techniques Tagged With: Doe Analysis, Standard Deviation

About Perry Parendo

Perry's Solutions, Inc. was founded to help companies achieve product and process breakthroughs using Design of Experiments (DOE). Research of industry training programs shows they do not address the required applications for these tools, resulting in their training investment falling short of needed and wanted improvement. The company leverages their extensive DOE experience in new product development and manufacturing operations to bring you an innovative yet effective methodology for all developers desiring a quantum-leap improvement in product or process effectiveness.

« Clean, Green and Reliable – the book
Autonomous Vehicle Regulation – Could Less Actually Be More? »

Leave a Reply Cancel reply

Your email address will not be published. Required fields are marked *

Article by Perry Parendo
in the Experimental Design for NPD series

Join Accendo

Receive information and updates about articles and many other resources offered by Accendo Reliability by becoming a member.

It’s free and only takes a minute.

Join Today

Recent Posts

  • test
  • test
  • test
  • Your Most Important Business Equation
  • Your Suppliers Can Be a Risk to Your Project

© 2025 FMS Reliability · Privacy Policy · Terms of Service · Cookies Policy