Last week I posted about the Binomial probability density function, and it is useful when calculating the probability of exactly x successes out of n trials given p probability of success for each trial.
Well, what happens if you want to know the probability of 2 or more successes for example?
We could use the Binomial PDF formula to determine the probability of exactly two successes, then 3, then 4, etc. up to 8 (the example last week had eight trials). And adding those provides us a probability of 2 or more success out of 8 trials.
This is tedious. It does describe the nature of the cumulative density function for the binomial distribution. It is just the sum of individual pdf calculations over the range of interest.
$$ \large\displaystyle P\left( x,n,p \right)=\sum\limits_{i=0}^{x}{\left( \begin{array}{l}n\\i\end{array} \right){{p}^{i}}{{\left( 1-p \right)}^{n-i}}}$$
Turns out to be just as tedious as first outlined. We can sometimes reduce the number of calculations by remembering the the sum of all the probabilities for each x always tallies to 1. Therefore in this case where we are interested in the probability of 2 or more successes, we can calculate the values for zero and one success, sum those and subtract from one.
The probability of exactly 0 successes is 0.1678, and for exactly one success is 0.3355. Thus, we sum these two values and subtract from one, 1-(0.1678+0.3355) = 0.4967. Or, there is a little less than 50% probability of having 2 or more successes.
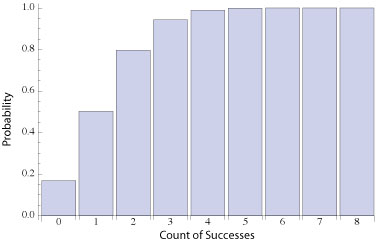
This plot is the CDF for p=0.2 and n=8. It shows the probability of less than or equal to a specific number of successes. The value of 1 success is just a little above 50%, and it is the tally of 0.1678 + 0.3355 = 0.5033.
The tally for 2 or fewer success include the probability for exactly two success, 0.2936, thus is 0.7969. This particular CDF approaches one quickly at about four successes.
Related:
binomial probability density function (article)
OC Curve with Binomial Method (article)
Common formulas (article)
Now add in confidence limits .
Fred, thanks for the work. I passed!
Gary Riggs
Hi Gary,
Thanks for the note and congratulations on passing!
Job well done.
cheers,
Fred
PS: be sure to follow this blog and join the Linkedin CRE Preparation group to help others preparing for the exam.
Hi Fred,
I was also successful in the CRE exams. Thanks again! I really want to apply this knowledge in the real world.
Hi Keron,
Congratulations to you!
Let us know what you’re working on and do ask any questions about how to best approach real world problems you find.
cheers,
Fred
Could you give us any practical applications and examples, please? Thanks.
A simple real world issue is how many spares should I take with me to a site knowing that, say 20% of the spares are bad (and I can’t tell until it’s installed – which is a different problem to solve).
p is 0.8 or the probability that the spare will work.
If I only take one spare, there is a 20% chance it will fail. So, how many should I carry to be say, 95% or more certain to have a working spare with me. One way to sort this out is to calculate the binomial CDF and when the chance of at least one working out of the minimum number is at least 95% then I have the number of spares to take along.
that is just one example, if anyone has others, please comment.
cheers,
Fred
Thank you, Fred.
How could there be a pdf for binomial as binomial is a discrete distribution and pdf is associated only to continuous distributions?
Hi Flavia,
You are right, it’s the probability mass function which serves the same view of the data as the PDF does for continuous distributions. I tend to use PDF for both, sorry for the confusion.
Cheers,
Fred