
Which of these six failure rate functions do your products and their service parts have? You don’t know? You don’t have field reliability lifetime data by product name or part serial number? That’s OK. Lifetime data are not required to estimate and classify failure-rate functions, including attrition and retirement. GAAP requires statistically sufficient field reliability data to classify failure rate functions for RCM.
This article comes from Chapter 16.1, “User Manual for Credible Reliability Prediction,” https://drive.google.com/file/d/1za5KT_qsF2sCSzGO7xi2EoHONBz2PwtZ/view/
Classical Failure Rate Classification
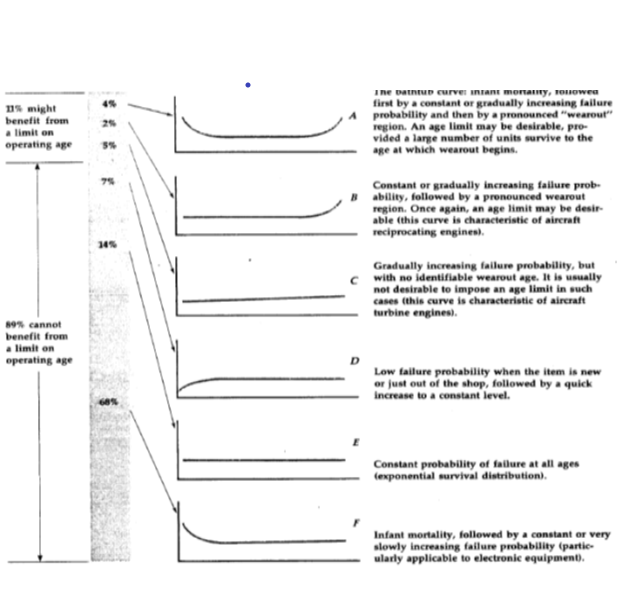
Nowlan and Heap wrote, “These six curves are derived from reliability analyses conducted over a number of years, during which all items analyzed were found to be one or another of the age-reliability relationships shown. The percentages indicate the percentage of items studied that fell into each of the basic patterns” (United Airlines). “…only curves A and B show wear-out characteristics.” “Some 89% of the items analyzed showed no wearout zone; therefore their performance could not be improved by the imposition of an age limit.”
NAVAIR failure-rate curves are similar to figure 1. NAVAIR guidelines say, “All failure modes will exhibit one of six characteristic conditional probability of failure curves [age-specific failure-rate functions]. Only items that illustrate wearout are likely to benefit from setting a life limit.” “Life limits should not be assigned to items that produce any of the three (conditional probability of failure) curves that do not show wearout. An item conforming to one of these non-wearout patterns will not benefit from a life limit because there is no correlation showing an increasing probability of failure as time progresses. Imposition of life limits on items conforming to one of the non-wear out patterns will result in discarding or reworking items unnecessarily. At a minimum, this will result in excessive costs. It may even increase the probability of failure through the introduction of infant mortality.”
US Army TM 5-698-2 curves are similar to figure 1. TM 5-698-2 says, “For some items, the underlying distribution is exponential and the item exhibits a constant failure rate. In such cases, a new item used to replace an old item has exactly the same probability of failing in the next instant of time as did the old item. Consequently, changing such an item at some prescribed interval has no effect on the probability of failure. It makes more sense to run the item to failure.” Only a small percentage of items can benefit from PM. Knowing the underlying distribution of times to failure is essential in determining if PM is applicable.”
Reported Relative Proportions of the Alternatives Differ
Table 1. Claimed proportions of failure rate functions. “IM” stands for infant mortality.
| Description | Nowlan-Heap 1978 | UAL 1968 | Broberg 1973 | NAVAIR 1982 MEP | SSMD | SUBMEP 2001 | |
| Bathtub | A | 4% | 4% | 3% | 3% | 6% | 2% |
| Constant, wearout | B | 2% | 2% | 1% | 17% | 10% | |
| Increasing | C | 5% | 5% | 4% | 3% | 17% | |
| Increasing, constant | D | 7% | 7% | 11% | 8% | 9% | |
| Const. | E | 34% | 14% | 15% | 42% | 60% | 56% |
| IM, const. | F | 48% | 68% | 66% | 29% | 33% | 6% |
| Totals | 100% | 100% | 100% | 102% | 99% | 100% |
Table 2. Statistics of claimed proportions. “CV” stands for coefficient of variation = Standard Deviation/Average. Large CV means large disagreement.
| Description | Average | Stan. Dev. | CV | |
| Bathtub | A | 4% | 1.50% | 42% |
| Constant, wearout | B | 8% | 7.50% | 100% |
| Increasing | C | 7% | 6.50% | 90% |
| incr, const | D | 9% | 1.70% | 20% |
| Const. | E | 37% | 21.90% | 59% |
| IM, const. | F | 40% | 26.40% | 65% |
| Total | 105% |
There are other age-specific failure-rate functions. Preventive maintenance introduces glitches in failure-rate functions. “The Bathtub Curve Doesn’t Always Hold Water” article hypothesizes that attrition causes an eventually decreasing failure rate due to non-use and non-reporting of failures, and, consequently, no action except perhaps to sell customers new products.
Statistical Failure Rate Function Classification
People say lifetime data are required to estimate age-specific failure-rate functions. Only approximately 75 “safety-critical” systems per aircraft are monitored by serial number, hours, and cycles to obtain life data. The greatest common denominators of table 1 proportions make me think only ~30-50 parts’ or systems’ failure-rate functions were estimated. Weibull analyses can’t model infant mortality AND wearout, because few wear out. Consequently RCM failure rate classification has evolved into subjective classification, unnecessarily.
System structure functions, redundancy, standby, intermittent operation, could lead to constant failure rates and, consequently, no system maintenance even though part maintenance is required! If a system has a constant failure rate, RCM suggests no maintenance. Imagine a two-component system in parallel-redundancy, hot-standby, or sequential alternation: choose one component with infant mortality (failure rate =-a) and the other with wearout (failure rate =+b). If system operation alternates between the two components, randomly choose which one to start first. If infant mortality and wearout rates and times are chosen carefully, this parallel-redundant system could have constant failure rate and consequently seem to require no maintenance at all. System failure-rate function is -a*t+b*t = constant, with requires failure rate a and b be age-dependent a/b=constant/t. Contact me if you want the Weibull alternative.
Most of the failure-rate functions in figure 1 include linear segments splined together (perhaps with a French curve). Why not fit piecewise-linear failure-rate function to a nonparametric estimate of age-specific failure-rate function and choose the piecewise-linear pattern that fits best, without overfitting? Piecewise-linear bathtub curves have been proposed [Jasingh, Huaiyuan et al.]. Huaiyuan et al. fit other functions too, Bayesianly.
- T. M. Allen fit a 3-rd order polynomial to SSN 688 salvage-air valve failure rate function
- McLeod et al. proposed J, K, L, M variations on constant failure rates. What happened to G, H, and I? Nowlan and Heap proposed A-F.
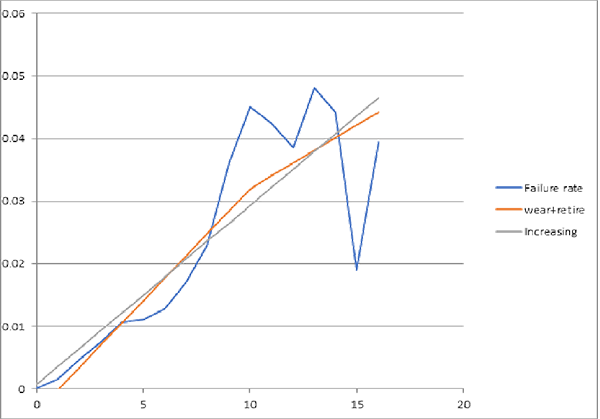
- Deven’s bathtub best-fit piecewise-linear failure rate function is wearout followed by retirement (figure 2).
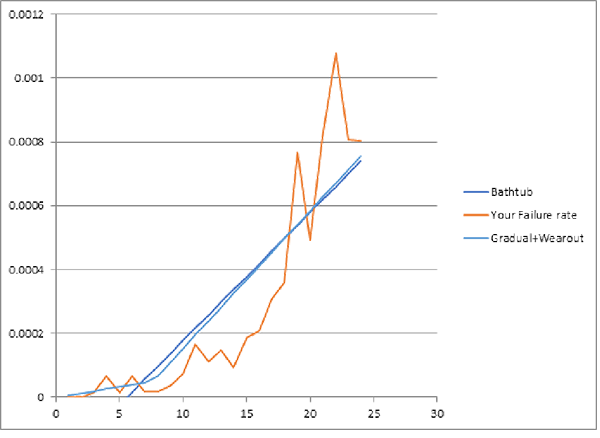
- Australian phone poles show slowly increasing failure rate followed by rapidly increasing failure rate (figure 3)
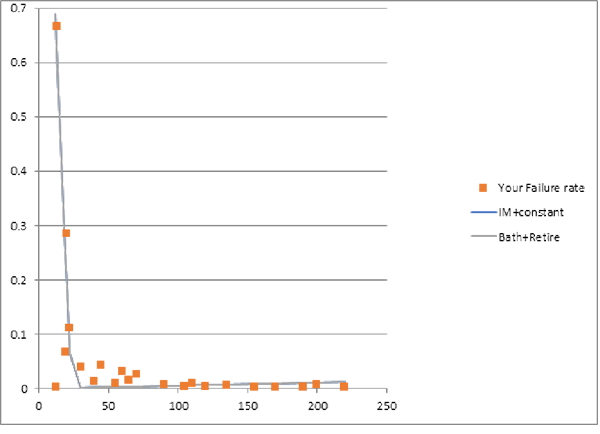
- Ball bearings show infant mortality followed by wearout, without any constant failure rate (figure 4)
Here’s how to fit piecewise-linear failure-rate functions. Compare piecewise-linear approximate failure-rate functions with nonparametric estimates of failure-rate functions, from life data or from parts’ period installed base and failure counts or ships and returns counts, if you don’t have lifetime data. That is, Identify piecewise-linear approximation to the nonparametric failure-rate function estimate, perhaps even from credible reliability predictions from comparison products’ or parts’. Pick the piecewise-linear failure-rate function with least-squared error, maximum likelihood, or Kullback-Leibler divergence (cross-entropy) from the nonparametric failure-rate function estimate. Piecewise-linear functions can be fit with less data than curves, even if some data is censored. Figures 2-4 show some examples. They show nonparametric estimates of failure-rate functions and piecewise-linear approximations made by least squares. “SSE” is the sum of squared errors between the nonparametric estimates and the piecewise-linear approximations.
Piecewise-linear failure-rate functions; aka “segmented linear regression” does this: find spline knot-points and slopes to maximize coefficient of determination: R2 = SS(residuals)/SS(total) or to minimize SSE (Sum of Squared Errors) between the piecewise linear failure rate function and the nonparametric failure-rate function estimate â(t). I.e., minimize S[â(t)–a(i)–b(i)*t]2 with spline knot points at ages t(i)=(–a(i)+a(i+1))/(b(i)–b(i+1)) for i = 1,2,3. Knot point t(3) is start of retirement or attrition, decreasing failure rate after wearout if any. (I apologize for ambiguous â(t), a(i), and b(i). The a(i) and b(i) are regression coefficients.)
Use Excel Solver with increasing knot constraints 0<t(1)<t(2)<t(3). Don’t constrain coefficients a(i) and b(i) but make sure they are reasonable. Repeat for subsets of knot points 1,2,3 among the six alternative curves (figure 1) or those that seem reasonable candidates from shape of nonparametric estimated failure-rate function â(t). Pick the piecewise-linear function with smallest R2, SSE, likelihood ratio, or Kullback-Leibler divergence and deal with infant mortality or apply inspection, PM, cost, etc., accordingly, if called for.
Safety-Critical parts
FSCAP (Flight Safety-Critical Aircraft Parts), http://fsims.faa.gov/wdocs/8900.1/v08%20tech%20functions/chapter%2007/08_007_001.htm are governed by 14 CFR Part 25, Subpart F: Equipment, Systems & Installations. Approximately 75 FSCAP DC-9 parts per aircraft are tracked by serial number, hours and cycles (life data). “Any part, assembly, or installation containing a critical characteristic whose failure, malfunction or absence could cause a catastrophic failure resulting in loss or serious damage to the aircraft or an un-commanded engine shutdown resulting in an unsafe condition. “
Safety-Critical Systems include structure, engine and propulsion systems, flight and ground control systems, fuel tank, fire suppression and detection, engine containment, icing, etc. I can’t find lists of safety-critical parts for any aircraft. I used to find the DC-9 list, because the year 2000 Alaska Airlines flight 261 crash off Oxnard, California was caused by part(s) not on safety-critical list.
After high school, I worked in an aircraft tool-and-die shop. I drilled 1024 holes in the die template for a “scatter shield.” Checker found 8 or 10 holes in slightly the wrong places; I fixed them. (I think I got that job because nobody else wanted it.) I asked, “What is a scatter shield?” They told me it was wrapped around gas turbine engines to contain parts if they disintegrate. Then I asked, “How thick is it?” They told me 1/16” aluminum and laughed. Select aircraft seats not adjacent to engine fans or disks.
Is Life Data Required?
14 CFR Part 25, Subpart F requires tracking FSCAP parts by serial number hours, and cycles to estimate actuarial rates. Several Oracle-based service databases track parts by name and hours, but what if product uses several parts of same name(s)? The EM (Estimation-Maximization) algorithm is used to make nonparametric estimates of age-specific field reliability of the parts; of course, the estimates are averages over the same-named parts. People don’t know failure-rate functions for parts without life data, and they are guessing about RCM.
Life data is NOT required to estimate actuarial rates! GAAP requires statistically sufficient installed base (from revenue, prices, and BoMs) and failure counts (from warranty claims or service costs, or spare parts’ consumption). Ships and returns counts are statistically sufficient, for nonparametric estimates of failure rate functions without life data. They are population data. Please refer to https://lucas-accendo-site-speed.sprod01.rmkr.net/renewal-process-estimation-without-life-data/ for an example. If you want failure rate function estimates from period installed base and failure counts and their RCM classifications, send data to pstlarry@yahoo.com.
System RCM is NOT Part RCM [George]
Implicit in the RCM standards’ codification are the assumptions that:
- Specified part reliabilities would achieve adequate system reliability
- Parts’ lives are statistically independent and completely describe system reliability
Assumptions that are ignored or invalidated in real life:
- Constant failure rate in operating hours yields constant failure rate in calendar hours and vice-versa
- Redundancy; e.g., parallel system with constant failure rate parts does not have constant system failure rate
- Common causes, subsystem interactions, load sharing, and other factors that result in dependence of part lives
- Equal, aging rates of parts, load-sharing, repair, independence of TBFs
The result is that system reliability may not be what is expected, great effort may be expended doing no maintenance, condition-monitoring, or inspection; parts other than “safety-critical” parts cause failures; and maintenance is inefficient. The cost of planned replacement per cycle (t) is [CpR(t)+Cu(1–R(t))]/òR(s)ds where integral in denominator is from 0 to t. Cp=planned, Cu=unplanned are costs per repair or replacement, and R(t) is field reliability function.
So, what now? Make nonparametric estimates of parts’ failure rate functions, to avoid unwarranted assumptions. Use parts’ ships and returns counts if you don’t have lifetime data. Classify nonparametric estimates of failure-rate functions with piecewise linear approximations according to SSE, or other goodness-of-fit measure. Repeat classification at system levels. Inspect, monitor, maintain, replace or do nothing depending on system and parts’ ages and piecewise-linear approximations to nonparametric estimates of failure rate functions.
References
T.M. Allen, U.S. Navy, “Submarine Maintenance Data and the Development of Age and Reliability Profiles,” Department of Defense, USA, http://www.plant-maintenance.com/articles/SubmarineMaintenanceDataRCM.pdf, 2001
Broberg, “Broberg´s Report,” USA, 1973, cited in Failure Diagnosis & Performance Monitoring, Vol. 11 edited by L.F. Pau, Marcel-Dekker, 1981
George, L. L. and Eva Langfeldt, “The Bathtub Curve Doesn’t Always Hold Water,” ASQC Reliability Review,Vol. 14, No. 3, pp. 5-7, Sept. 1994
George, L. L., “System Reliability-Centered Maintenance,” Ó2004, revised 2010
Huaiyuan, Li, Zuo Hongfu, Su Yan, Xu Juan, Yin Yibing, “Study on Segmented Distribution for Reliability Evaluation,” Chinese Journal of Aeronautics, 30(1): 310–329, https://doi.org/10.1016%2Fj.cja.2016.12.008, 2017
Jaisingh, Lloyd R., “A Flexible Bathtub Hazard Model for Nonrepairable Systems,” PhD dissertation, Texas Tech. Univ., 1985. (See https://doi.org/10.1016%2F0026-2714%2887%2990624-x for subsequent article.)
McKeague, Ian W. and Yichuan Zhao, “Width-Scaled Confidence Bands for Survival Functions,” Statistics & Probability Letters, 76, pp. 327–339, https://doi.org/10.1016%2Fj.spl.2005.08.006, 2006
McLeod, Jorge E. Núñez, Pedro Baziuk, Romina D. Calvo and Selva S. Rivera, “Failure Profiles for Maintenance in Industrial Facilities,” Proceedings of the World Congress on Engineering 2015 Vol II WCE 2015, London, U.K., July 1-3, 2015
NAVAIR 00-25-403, “Guidelines for the Naval Aviation Reliability-Centered Maintenance Process,” 01 July 2005
Nowlan, F. S. and Howard Heap, “Reliability-Centered Maintenance,” United Airlines, AD/AO66-579, Dec. 1978
SAE, “Evaluation Criteria for Reliability-Centered Maintenance (RCM) Processes-JA1011,” August 1999 Revised August 2009
SSMD report, USA, 1993, cited in Reliability-Centered Maintenance Handbook, United States Navy, USA, 2007
Stephens, Paul, “Comparison of Estimating Parameters of the Weibull Distribution Using Bayesian and Maximum Likelihood Methods on Field Data,” Oct. 2004, US Army TM 5-698-2, “Reliability-Centered Maintenance (RCM) for Command, Control, Communications, Computer, Intelligence, Surveillance, and Reconnaissance (C4isr) Facilities,” 6 October 2006
Oops. That funny symbol in “[CpR(t)+Cu(1–R(t))]/òR(s)ds” should have been written out, [CpR(t)+Cu(1–R(t))]/INTEGRATE[R(s)ds, s = 0 to t] (R(s) is the reliability function, P[Life > s]