Accendo Reliability

Your Reliability Engineering Professional Development Site

  • Home
  • About
    • Contributors
  • Reliability.fm
    • Speaking Of Reliability
    • Rooted in Reliability: The Plant Performance Podcast
    • Quality during Design
    • Way of the Quality Warrior
    • Critical Talks
    • Dare to Know
    • Maintenance Disrupted
    • Metal Conversations
    • The Leadership Connection
    • Practical Reliability Podcast
    • Reliability Matters
    • Reliability it Matters
    • Maintenance Mavericks Podcast
    • Women in Maintenance
    • Accendo Reliability Webinar Series
  • Articles
    • CRE Preparation Notes
    • on Leadership & Career
      • Advanced Engineering Culture
      • Engineering Leadership
      • Managing in the 2000s
      • Product Development and Process Improvement
    • on Maintenance Reliability
      • Aasan Asset Management
      • AI & Predictive Maintenance
      • Asset Management in the Mining Industry
      • CMMS and Reliability
      • Conscious Asset
      • EAM & CMMS
      • Everyday RCM
      • History of Maintenance Management
      • Life Cycle Asset Management
      • Maintenance and Reliability
      • Maintenance Management
      • Plant Maintenance
      • Process Plant Reliability Engineering
      • ReliabilityXperience
      • RCM Blitz®
      • Rob’s Reliability Project
      • The Intelligent Transformer Blog
      • The People Side of Maintenance
      • The Reliability Mindset
    • on Product Reliability
      • Accelerated Reliability
      • Achieving the Benefits of Reliability
      • Apex Ridge
      • Metals Engineering and Product Reliability
      • Musings on Reliability and Maintenance Topics
      • Product Validation
      • Reliability Engineering Insights
      • Reliability in Emerging Technology
    • on Risk & Safety
      • CERM® Risk Insights
      • Equipment Risk and Reliability in Downhole Applications
      • Operational Risk Process Safety
    • on Systems Thinking
      • Communicating with FINESSE
      • The RCA
    • on Tools & Techniques
      • Big Data & Analytics
      • Experimental Design for NPD
      • Innovative Thinking in Reliability and Durability
      • Inside and Beyond HALT
      • Inside FMEA
      • Integral Concepts
      • Learning from Failures
      • Progress in Field Reliability?
      • R for Engineering
      • Reliability Engineering Using Python
      • Reliability Reflections
      • Testing 1 2 3
      • The Manufacturing Academy
  • eBooks
  • Resources
    • Accendo Authors
    • FMEA Resources
    • Feed Forward Publications
    • Openings
    • Books
    • Webinars
    • Journals
    • Higher Education
    • Podcasts
  • Courses
    • 14 Ways to Acquire Reliability Engineering Knowledge
    • Reliability Analysis Methods online course
    • Measurement System Assessment
    • SPC-Process Capability Course
    • Design of Experiments
    • Foundations of RCM online course
    • Quality during Design Journey
    • Reliability Engineering Statistics
    • Quality Engineering Statistics
    • An Introduction to Reliability Engineering
    • Reliability Engineering for Heavy Industry
    • An Introduction to Quality Engineering
    • Process Capability Analysis course
    • Root Cause Analysis and the 8D Corrective Action Process course
    • Return on Investment online course
    • CRE Preparation Online Course
    • Quondam Courses
  • Webinars
    • Upcoming Live Events
  • Calendar
    • Call for Papers Listing
    • Upcoming Webinars
    • Webinar Calendar
  • Login
    • Member Home

by Fred Schenkelberg 3 Comments

Interpolation within Distribution Tables

Interpolation within Distribution Tables

EDITED BY JOHN HEALY

Most statistics books and the CRE Primer have tables that permit you to avoid calculating the probability for common distributions. The normal distribution requires numerical methods to conduct the calculations and would not be feasible during the CRE exam.

Thus, you should master using the various tables. One of the skills required when using these tables is the ability to interpolate. This is the calculation of the value that lies between two values in the table.

Let’s look at an example, and you most likely will recall this simple procedure.

Example Problem

What is the probability of a value occur that is beyond 1.645 standard deviations above the mean?

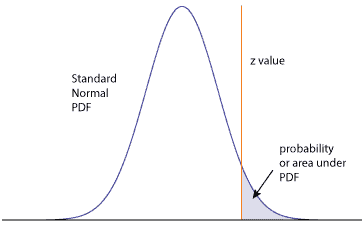
First, I recommend drawing a normal PDF and shade the area representing the probability of interest. Here the z-value is the given 1.645 and falls to the right or above of the mean. This helps with using the tables, especially if the table uses a different approach to displaying the data.

z-table-graphic

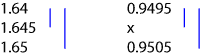
The Standard Normal Table provides three significant digits. Two in the first column and the third along the top row (in most tables – I’m referring the table in the CRE Primer). Thus we can find the probability for 1.64 and for 1.65, and not 1.645.

For z of 1.64 the probability is 0.9495 and for z of 1.65, the probability is 0.9505. This implies the probability of the z of 1.645 lies somewhere between 0.9495 and 0.9505.

For interpolating we assume a straight line relationship between the z-values and probabilities. While this may not be actually true, it is often close enough to determine the value for the fourth significant digit. We can use equivalent ratios to find the desired probability.

The Interpolation Process

We have the surrounding z-values and corresponding probabilities.

Again, assuming the linear relationship will provide a good enough estimate, we can use the idea that the ratios between the differences of the lower z-value and given z-value over the difference between the lower and upper z-values, is the same as the ratio for the corresponding probabilities.

Let’s draw this out.

Interpolation

The ratio of the short line to the long line is the same for the z-value and the corresponding probabilities. The x represents the unknown probability we would like to determine.

The Math Involved

So let’s calculate the two ratios

$$ \large\displaystyle \begin{array}{l}\text{z-value ratio}=\frac{1.645-1.64}{1.65-1.64}=\frac{0.005}{0.01}\\\text{probability ratio}=\frac{x-0.9495}{0.9505-0.9495}=\frac{x-0.9495}{0.001}\end{array}$$

We have two ratios that are equal and one unknown, x. So set the two ratio’s as equal to each other and solve for x.

$$ \large\displaystyle \begin{array}{l}\frac{0.005}{0.01}=\frac{x-0.9495}{0.001}\\x-0.9495=\left( \frac{0.005}{0.01} \right)0.001\\x=\left( \frac{0.005}{0.01} \right)0.001+0.9495\\x=0.0005+0.9495=0.9500\end{array}$$

Just a bit of practice and this becomes a quick calculation.


Related:

Reading a Standard Normal Table (article)

z value (article)

How to read a standard normal table (article)


Filed Under: Articles, CRE Preparation Notes, Probability and Statistics for Reliability Tagged With: Discrete and continuous probability distributions

About Fred Schenkelberg

I am the reliability expert at FMS Reliability, a reliability engineering and management consulting firm I founded in 2004. I left Hewlett Packard (HP)’s Reliability Team, where I helped create a culture of reliability across the corporation, to assist other organizations.

« Life Estimates Based on Supplier Data
Mechanical Systems Reliability Testing »

Comments

  1. Sneha Yadav says

    September 6, 2021 at 11:58 PM

    Thanks for the description, It was really briefed in well manner.
    I need suggestion for “how can I choose interpolation method based on the calculation of critical value”.

    Kindly requesting you to suggest the reliable answer.

    Reply
    • Fred Schenkelberg says

      September 7, 2021 at 10:01 AM

      This article uses a linear interpolation – as we do not have any information to suggest other than a linear relationship between values in the table. There are other methods, and those require knowing the details of the relationship presented in the table. In my experience, if we have the formula used to create the table, and need to interpolate – I would just use the formula directly and avoid interpolation all together.

      cheers,

      Fred

      Reply
  2. Krishneshwar Yadav says

    September 7, 2021 at 12:06 AM

    Thanks for the description, It was really briefed in well manner.

    Reply

Leave a Reply Cancel reply

Your email address will not be published. Required fields are marked *

CRE Preparation Notes

Article by Fred Schenkelberg

Join Accendo

Join our members-only community for full access to exclusive eBooks, webinars, training, and more.

It’s free and only takes a minute.

Get Full Site Access

Not ready to join?
Stay current on new articles, podcasts, webinars, courses and more added to the Accendo Reliability website each week.
No membership required to subscribe.

[popup type="" link_text="Get Weekly Email Updates" link_class="button" ]

[/popup]

  • CRE Preparation Notes
  • CRE Prep
  • Reliability Management
  • Probability and Statistics for Reliability
  • Reliability in Design and Development
  • Reliability Modeling and Predictions
  • Reliability Testing
  • Maintainability and Availability
  • Data Collection and Use

© 2025 FMS Reliability · Privacy Policy · Terms of Service · Cookies Policy