Using Leading & Lagging KPIs Can Make The Difference In Driving Performance, By Allowing You To See Into The Future.
This is the second part of a mini series on Key Performance Indicators. If you haven’t already please read the first post of this series on KPIs.
KPIs are often used to measure the past performance of a process, but did you know that they can be used to see into the future and predict the performance of the organization?
KPIs can be used to measure past performance, or predict future performance. This is because there is a cause and effect relationship between leading and lagging KPIs. When a process is measured, it will in turn effect another process which is also being measured, providing insight to future performance.
When Leading and Lagging KPIs are properly understood it provides unique insights to where the performance of the organization is going. The differences between Leading and Lagging KPIs as described within Maintenance & Reliability Best Practices;
- Leading KPIs measure performance before the business or process result starts to follow a particular pattern or trend. Leading KPIs are used to predict changes or trends, as well as forward looking and help to manage the performance of a system or process.
- Lagging KPIs measure performance after the business or process follow a pattern or trend and is used to confirm long-term trends. Lagging indicators are used to determine how well a process or system was managed.
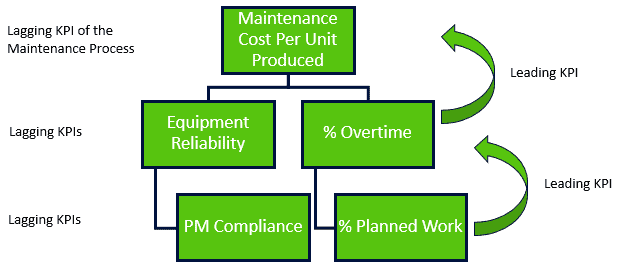
For example, most organizations measure PM Compliance, which is a lagging KPI when being used to measure the performance of the work management process. When the PM Compliance KPI is used in the Equipment Strategy process, it can be used to predict equipment reliability. This is because as PM Compliance increases, the reliability of the equipment should increase.
A word of caution, KPIs can be both leading and lagging depending on where in the process they are located. As such it is critical to fully understand the relationship between leading and lagging KPIs to ensure they are used correctly.
So how do you determine or structure you KPIs to predict the future performance of the organization? Start with the goal that you are striving to achieve. This is usually a cost measure of maintenance such as Maintenance Cost / Unit Produced. With this goal, start to determine which processes will drive the improvement in the end goal. In the case of Maintenance Cost / Unit Produced, equipment reliability will lead to reduced costs, as will a reduction in overtime. Therefore equipment reliability and % overtime are leading indicators of Maintenance Cost / Unit Produced.
When the KPIs are organized in this hierarchical structure, it is easy to see which KPIs are Lagging and Leading, and how future performance can be predicted. Regardless whether the KPI is leading or lagging, it is critical that the information and trends being described by the KPIs, are acted upon. Because if they are not, there is no point in measuring them.
Do you use Leading or Lagging indicators in your organization? What proportion of each do you utilize? I encourage you to share your stories, as everyone benefits from sharing experiences and learnings.
Stay tuned to next week’s post on balance score cards. Balanced score cards ensure that the long term performance is not sacrificed for short term improvements in various aspect of your maintenance & reliability program.
Remember, to find success, you must first solve the problem, then achieve the implementation of the solution, and finally sustain winning results.
I’m James Kovacevic
HP RELIABILITY
Solve, Achieve, Sustain
Featured image by www.manoftaste.de

Excellent article on KPIs.it means OEEis a lagging indicator and availability is leading indicator.so where does MTBF and MTTR fit in this.
Hi Amit, I’m sure James has a comment on MTBF, yet in my opinion you’d be better served by avoiding the use of MTBF or similar measures – they rarely provide any useful information and often increase misunderstanding of what is happening concerning reliability. cheers, Fred