Accendo Reliability

Your Reliability Engineering Professional Development Site

  • Home
  • About
    • Contributors
  • Reliability.fm
    • Speaking Of Reliability
    • Rooted in Reliability: The Plant Performance Podcast
    • Quality during Design
    • Way of the Quality Warrior
    • Critical Talks
    • Dare to Know
    • Maintenance Disrupted
    • Metal Conversations
    • The Leadership Connection
    • Practical Reliability Podcast
    • Reliability Matters
    • Reliability it Matters
    • Maintenance Mavericks Podcast
    • Women in Maintenance
    • Accendo Reliability Webinar Series
  • Articles
    • CRE Preparation Notes
    • on Leadership & Career
      • Advanced Engineering Culture
      • Engineering Leadership
      • Managing in the 2000s
      • Product Development and Process Improvement
    • on Maintenance Reliability
      • Aasan Asset Management
      • AI & Predictive Maintenance
      • Asset Management in the Mining Industry
      • CMMS and Reliability
      • Conscious Asset
      • EAM & CMMS
      • Everyday RCM
      • History of Maintenance Management
      • Life Cycle Asset Management
      • Maintenance and Reliability
      • Maintenance Management
      • Plant Maintenance
      • Process Plant Reliability Engineering
      • ReliabilityXperience
      • RCM Blitz®
      • Rob’s Reliability Project
      • The Intelligent Transformer Blog
      • The People Side of Maintenance
      • The Reliability Mindset
    • on Product Reliability
      • Accelerated Reliability
      • Achieving the Benefits of Reliability
      • Apex Ridge
      • Metals Engineering and Product Reliability
      • Musings on Reliability and Maintenance Topics
      • Product Validation
      • Reliability Engineering Insights
      • Reliability in Emerging Technology
    • on Risk & Safety
      • CERM® Risk Insights
      • Equipment Risk and Reliability in Downhole Applications
      • Operational Risk Process Safety
    • on Systems Thinking
      • Communicating with FINESSE
      • The RCA
    • on Tools & Techniques
      • Big Data & Analytics
      • Experimental Design for NPD
      • Innovative Thinking in Reliability and Durability
      • Inside and Beyond HALT
      • Inside FMEA
      • Integral Concepts
      • Learning from Failures
      • Progress in Field Reliability?
      • R for Engineering
      • Reliability Engineering Using Python
      • Reliability Reflections
      • Testing 1 2 3
      • The Manufacturing Academy
  • eBooks
  • Resources
    • Accendo Authors
    • FMEA Resources
    • Feed Forward Publications
    • Openings
    • Books
    • Webinars
    • Journals
    • Higher Education
    • Podcasts
  • Courses
    • 14 Ways to Acquire Reliability Engineering Knowledge
    • Reliability Analysis Methods online course
    • Measurement System Assessment
    • SPC-Process Capability Course
    • Design of Experiments
    • Foundations of RCM online course
    • Quality during Design Journey
    • Reliability Engineering Statistics
    • Quality Engineering Statistics
    • An Introduction to Reliability Engineering
    • Reliability Engineering for Heavy Industry
    • An Introduction to Quality Engineering
    • Process Capability Analysis course
    • Root Cause Analysis and the 8D Corrective Action Process course
    • Return on Investment online course
    • CRE Preparation Online Course
    • Quondam Courses
  • Webinars
    • Upcoming Live Events
  • Calendar
    • Call for Papers Listing
    • Upcoming Webinars
    • Webinar Calendar
  • Login
    • Member Home

by nomtbf Leave a Comment

Let the data talk

Let the data talk

Plot the data

A table of numbers is not information, it is data. It is information that we need to make decisions, to notice differences and to detect patterns. It is a plot of the data that is often all that we need to interpret the data.

One of my first jobs in industry was with a plant manager that insisted we “Speak with data!”. Any proposal or report had to include the data and it told the story. No data, no story, no approval.

A Data Example

Let’s work an example and see how even simple plots can help us find the story the data wants to tell.

Here’s some data from a piece of equipment. When it fails a technician responds and repairs the equipment. The data is the time of the failure report in hours from the start of the year. Thus, 58.45 hours is a little over two days since the start of the year.

Here’s a screen shot of the data in a spreadsheet. All data is in hours.

MCF raw data

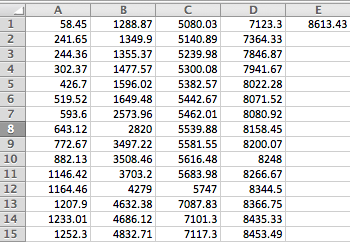
Even studying the table of numbers doesn’t help reveal the story within the 61 pieces of data. We do know that there are about 2 failures per month on average. There seems to be groups of failures, and a few stretches without failures.

First Plot of the Data

A good first plot for any dataset is a Histogram. It may reveal a pattern or part of story.

Since the data was collected over a year, I created the first plot with 12 bins which will roughly break down the failure data into month-long buckets.

mcf histogram

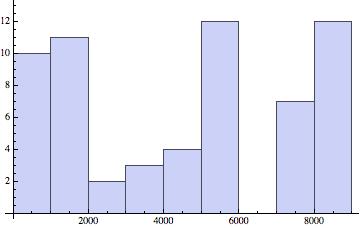
No obvious pattern.We might need more data going back a few years, or possibly plotting time between failures would be more revealing. It’s easy to experiment and quickly detect if any explainable pattern exists.

A Mean Cumulative Function Plot

Since the data is from a single repairable unit, I’ll try a mean cumulative function plot. It is a plot of time in hours versus the count of failures to date. With each failure the vertical position of the plotted point is incremented up by one.

MCF example

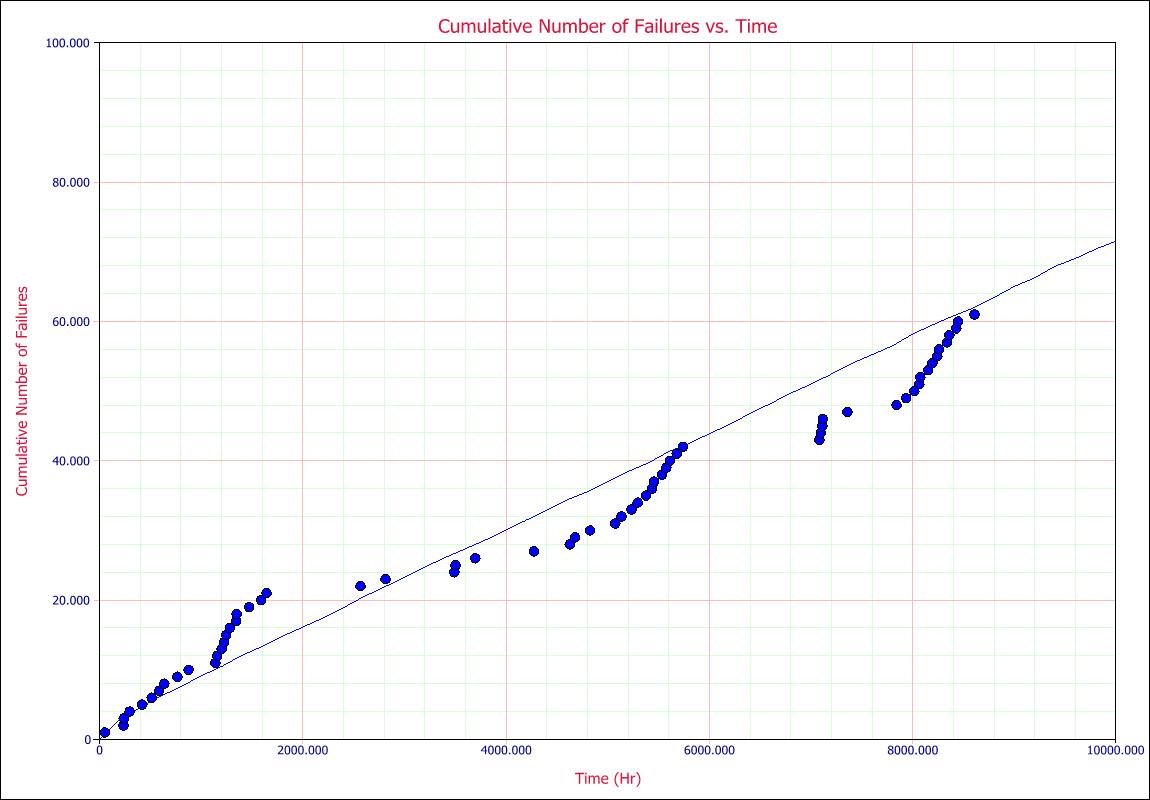
Now, this is interesting. What are those groups of failures and what happened to cause a long period without failures? Are the repairs helping or hurting the reliability of the system?

These questions come from the plot of the data. This is the start of the story.

With a few queries, we learned that the clusters of failures are commonly a string of no trouble found. The technician did a quick visual inspected, started the equipment and moved on to the next project. After a string of maybe 10 no trouble founds a relatively major repair would take place. In two of the instances the equipment was down for a couple of weeks (hence no failures showing over an extended period.)

Summary

Tracking a grand average of downtime or number of failures per month did not reveal much information. The mean cumulative function plot caused us to ask a few questions, to look at specific repair logs, and to explore why the pattern we see happens.

Looking at a table of numbers or a log sheet of repair notes is a very difficult way to determine what is happening. A simple plot is often all that is needed to hear what the data has to say.

Plot the data a few different ways. Learn to hear what the data has to say. Find the questions that may lead you to making reliability improvements.

Filed Under: Articles, NoMTBF

« Three Considerations for Sample Size
The Learning and Teaching Route to Success »

Leave a Reply Cancel reply

Your email address will not be published. Required fields are marked *

[popup type="" link_text="Get Weekly Email Updates" link_class="button" ]

[/popup]

The Accendo Reliablity logo of a sun face in circuit

Please login to have full access.


Lost Password? Click here to have it emailed to you.

Not already a member? It's free and takes only a moment to create an account with your email only.

Join

Your membership brings you all these free resources:

  • Live, monthly reliability webinars & recordings
  • eBooks: Finding Value and Reliability Maturity
  • How To articles & insights
  • Podcasts & additional information within podcast show notes
  • Podcast suggestion box to send us a question or topic for a future episode
  • Course (some with a fee)
  • Largest reliability events calendar
  • Course on a range of topics - coming soon
  • Master reliability classes - coming soon
  • Basic tutorial articles - coming soon
  • With more in the works just for members
Speaking of Reliability podcast logo

Subscribe and enjoy every episode

RSS
iTunes
Stitcher

Join Accendo

Receive information and updates about podcasts and many other resources offered by Accendo Reliability by becoming a member.

It’s free and only takes a minute.

Join Today

Dare to Know podcast logo

Subscribe and enjoy every episode

RSS
iTunes
Stitcher

Join Accendo

Receive information and updates about podcasts and many other resources offered by Accendo Reliability by becoming a member.

It’s free and only takes a minute.

Join Today

Accendo Reliability Webinar Series podcast logo

Subscribe and enjoy every episode

RSS
iTunes
Stitcher

Join Accendo

Receive information and updates about podcasts and many other resources offered by Accendo Reliability by becoming a member.

It’s free and only takes a minute.

Join Today

Recent Articles

  • test
  • test
  • test
  • Your Most Important Business Equation
  • Your Suppliers Can Be a Risk to Your Project

© 2025 FMS Reliability · Privacy Policy · Terms of Service · Cookies Policy