
Most of us rely on accurate measurements. If these measurements are unreliable, then our decisions could be based on false information. How can we have confidence in our measurements?
The purpose of a measurement system analysis is to determine if a gauge is fit for use. This means that we can rely upon the measurements to give us a true indication of the parameter being measured. Our decisions will not be affected by erroneous data. So how can we know the quality of our measurements?
Basic Statistics
When measurements are displayed in a histogram, the most common pattern shown is a bell shape curve. There is an obvious center and the spread of the data is approximately symmetrical about the center. Since this is the pattern displayed by normally distributed data, we say the measurements are normally distributed. If the pattern does not show a bell shaped curve, we look for another distribution to describe the data. In this article, the normal is assumed.
The average of all the data is used for the center. If there are N measurements, then
$$\bar{X}=\frac{1}{N}\sum_{i=1}^{i=N}{X_i}$$
(1)
The spread can be characterized as the width of an interval that contains 99% of the population. The estimates are derived from estimates of which are calculated as
$$\sigma=\frac{R}{d_2}$$
(2)
Here R is the range and $-d_2-$ is a factor dependent on sample size. The alternative is to use
$$\sigma = \sqrt{\sum_{i=1}^{i=N}\frac{(X_i-\bar{X})^2}{N-1}}$$
(3)
where every sample point is used in the calculation of the standard deviation, not just the highest and lowest values.
In measurement systems analysis, a symmetric 99% population interval is customarily used as a cutoff of the distribution since the normal tails theoretically extend to -$-\infty-$ and $-+\infty-$. The 99% spread for the normal is
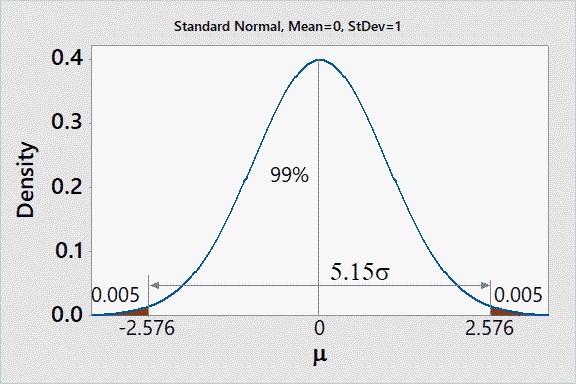
Figure 1
Here the 99% probability interval is the total spread (TV) or tolerance interval. Since the normal is symmetric, the spread is centered on the mean.
$$TV =5.15\sigma$$
(4)
Calibration
As with any data, measurements are subject to random variation. When calibrating a gage, repeated measurements should be collected on a reference standard that is traceable to a national standard. Bias is the difference between the sample average and the reference. A hypothesis test can be used to determine if the bias is the result of random variation is of statistically significant. If significant, we say the gage is biased, high or low. The next article in this series, https://lucas-accendo-site-speed.sprod01.rmkr.net/measurement-system-bias/, discusses how to obtain a point estimate of gage bias.
Eventually, the bias should be checked over the gage operating range to determine if the bias is constant or displays a pattern. A common pattern is a linear variation of the bias over an operating range. The linearity can be analyzed to determine if it is statistically different from 0 bias. The article, https://lucas-accendo-site-speed.sprod01.rmkr.net/measurement-system-gage-linearity/, discusses the analysis of gage linearity.
Stability is the change in gage bias over time, or perhaps usage cycles. Gages should be checked periodically. For a new gage, the checking interval may initially be a guess, but over time the measurement intervals can be refined with experience. My article on stability has not been written yet, but a link will be inserted here when published.
Gage Repeatability and Reproducibility Study
Measurement spread is analyzed separately in a study is conducted where the gage is to be used. Let’s define the appraiser as somebody who takes the measurements. These should be the people who will normally use the gage. In the study, appraisers repeatedly measure a specific feature on each part using the gage being studied. Again, a histogram of the measurements should display a bell shape curve. Again, there is a center and spread of the measurements.
For the GR&R study, the focus is on the spread in actual usage as the bias has already been determined. The goal of the study is to determine how much of the measurement variation is due to the parts, the assessor, and the gage. Our objective is to measure the part variation (PV), not the assessor variation (AV) or the gage variation. Gage variation is also called equipment variation (EV).
GR&R is a systematic way to conduct this study. It follows a DOE approach where the Factors are Parts and Assessors. The part levels are the individual parts. The assessor levels are the individuals who are taking the measurements. The repeated measurements are called trials or replication. The DOE approach separated the total variation into its parts:
$$TV^2=PV^2+AV^2+EV^2$$
(5)
The approach is a full factorial DOE, i.e., all combination of Parts and Assessors define the measurement conditions. For example, if there are 5 assessors and 5 parts, then there will be 25 (5×5) combinations. If there are 3 assessors and 10 parts, then there are 30 (3×10) combinations. Within each combination, there will be a number of trials, i.e., repeated measurements. However, the order needs to be randomized as much as possible. Ideally, randomize the assessors and the parts. Don’t repeat trials in succession.
For each measurement, one needs to record the assessor and the part measured. A pre-defined data sheet is helpful for controlling the study. The assessors measure parts in the order found in the data sheet. One must be cautious the keep the assessors from knowing the other assessors’ measurements. This implies that one or more personnel are required to control the assessment and record the data.
Analysis
Once the data is collected, the analysis can start. The total variation spread (TV) or spread in the data can be calculated using equations 2 or 3, plus equation 4. The total variation is partitioned using either the Average and Range method or the ANOVA method. Either analysis produces similar results. The difference resides in the underlying statistical approach.
The Average and Range Method relies on estimates of variation derived from the range and sample size. The ANOVA method uses all of the data to calculate statistical parameters. Both methods separate the total variation into that attributable to parts, assessors, and equipment, equation 5. Interactions among the factors are not considered.
The GRR is defined as the variation, or spread, attributable to the equipment and assessors.
$$GRR^=AV^2+EV^2$$
(6)
Or
$$GRR^2 = TV^2-PV^2$$
(7)
The effect of the GRR/ TV on the TV/PV can be used to determine if the GRR is acceptable.
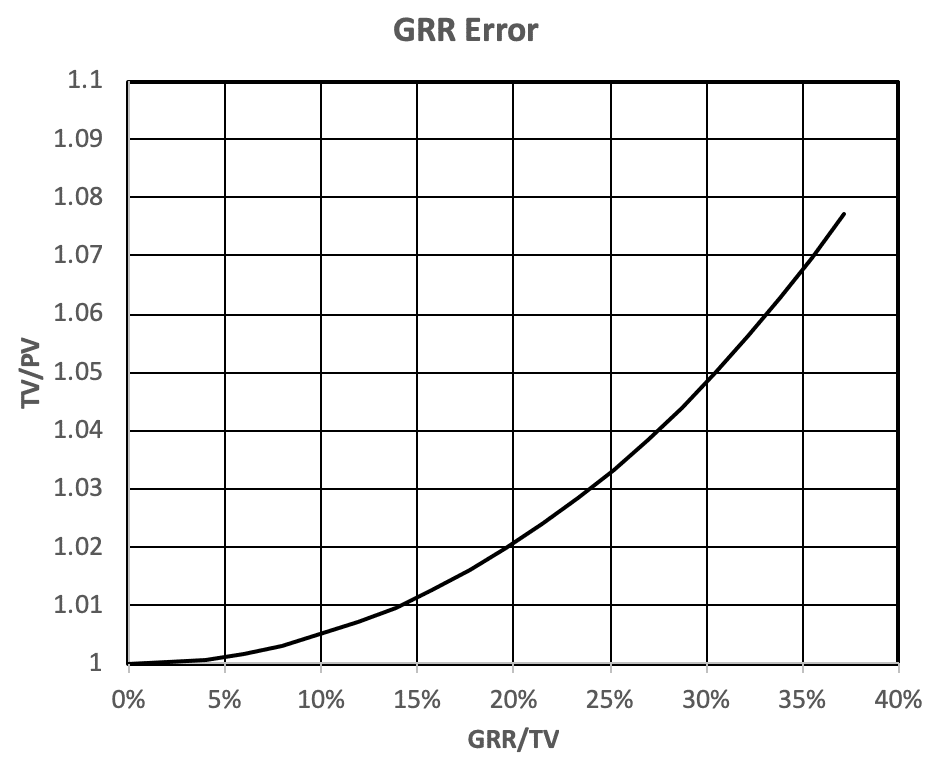
Figure 2
Figure 2 shows that if GRR = 0, then, the total variation equals part variation. This would be the ideal situation, but this situation doesn’t exist in the real world. Experience shows GRR ≠ 0. If GRR/TV = 0.1, then TV/PV = 1.005, i.e., inflated by 0.5%. When GRR/TV = 0.3, then TV/PV = 1.05, i.e., inflated by about 5%. This leads to the generally accepted criteria that a gage is acceptable if GRR/TV < 0.1, unacceptable if GRR/TV>0.3, and marginal otherwise.
Tolerance
If there is an engineering specification that defines a tolerance on the feature being measured, then the GRR is compared to the tolerance (TOL) instead of the total variation (TV). The same acceptable, marginal, and excessive criteria apply.
Conclusions
For anybody collecting measurements, the gage bias needs to be known and the gage needs to provide measurements without excessive assessor and gage variation. The GRR variation can be partitioned into assessors and the gage (equipment) variation. The criteria for gage acceptability is
- Acceptable if $-GRR/TV<0.1-$ or $-GRR/TOL<0.1-$
- Marginal if $-0.1\leq GRR/TV\leq 0.3-$ or $-0.1\leq GRR/TOL\leq 0.3-$
- Excessive if $-GRR/TV>0.3-$ or $-GRR/TOL>0.3-$
Dennis Craggs, Consultant
Quality, Reliability, and Analytics Services
810-964-1529
Leave a Reply