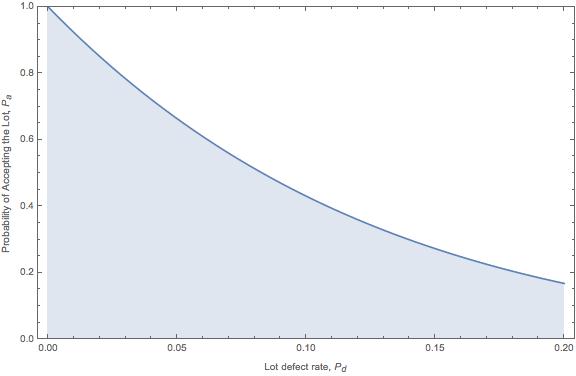
The operating characteristic curve is useful to understand the capability of a lot sampling plan. It depicts a graphical relationship between the unknown lot’s defect rate and the probability of the specific sampling plan to accept the lot. Ideally, we want a sampling plan the correctly accepts good lots and rejects bad lots.
There are three methods to calculate the probability of acceptance: Hypergeometric, binomial and Poisson distribution methods. In this article let’s consider a lot size that is very large compared to the inspection sample, such that removing the sample does not materially change the ratio of bad items to good.
The binomial distribution is described here. It is a useful distribution to determine probability of selecting some number of defects given a probability of selecting a defect with each item drawn. We can use the probability density function, PDF, to calculate the probability of observing exactly d defects in a sample of n items drawn from a population with p fraction of defective items per lot.
$$ \large\displaystyle {{P}_{d}}=f\left( d \right)=\frac{n!}{d!\left( n-d \right)!}{{p}^{d}}{{\left( 1-p \right)}^{n-d}}$$
The probability of acceptance is the probability that d, the number of defects is less than or equal to c, the accept number in the lot sampling plan. The binomial cumulative density function is just the sum of PDF probability from zero to c.
$$ \large\displaystyle {{P}_{a}}=P\left( d\le c \right)=\sum\limits_{d=0}^{c}{\frac{n!}{d!\left( n-d \right)!}{{p}^{d}}{{\left( 1-p \right)}^{n-d}}}$$
A lot sample example
Let’s say we have lot’s of 500 units and we’re are considering using the ANSI/ASQ Z1.4 – 2008 Sampling Procedures and Tables for Inspection by Attributes S-3 inspection level and single sampling plan. It directs us to select 8 samples from each lot. The acceptance is with no defects in the sample, c=0 and reject the lot is there is one defect in the sample.
We calculate Pa for a range of lot defect rates (recall it is unknown) to create the OC curve. Let’s determine the probability of acceptance for a lot that has 5%, p = 0.05, defects. With an accept number of zero, the sum doesn’t apply as we’re only considering the chance that the sample will have all acceptable units.
$$ \large\displaystyle {{P}_{a}}=P\left( d\le 0 \right)=\sum\limits_{d=0}^{0}{\frac{8!}{0!\left( 8-0 \right)!}{{.05}^{0}}{{\left( 1-.05 \right)}^{8-0}}=}0.663$$
Looking closely, when the sampling plan has an accept number of zero the binomial CDF reduces to just the probability of drawing a good unit raised to the number of samples drawn, n.
We repeat the calculation over the range of unknown lot defect rates, p, of interest and then plot the OC curve.
Conclusions
With any sampling plan, it depends on what defect rate we are willing to accept. In a perfect world, all items in a lot will be fine. In reality, we expect some small fraction to have defects. In the case above, if the lot actually arrives with a 10% defect rate, the sampling plan would accept the lot about 45% of the time. To me, that isn’t very good, yet may be fine for your situation.
Be sure to consider the cost of your product’s failure due to a faulty component and the cost of either purchasing a lower defect rate source of parts or increasing lot inspection to minimize bad parts getting into your product. It is always a tradeoff, yet can be a useful tool to improve the reliability of your products.
Related:
OC Curve with Hypergeometric Method (article)
How to read an OC curve (article)
Sequential Sampling by Attributes (article)

I know very little about this but I am attempting to deploy a tool for displaying these results (only using provided math). I am told over and over that the binomial distribution is not the right approach in determining an OC curve for continuous data — only for pass fail data. I have been looking at one web site after another and I can not find anything that specifically addresses an OC curve for continuous data. Any comments?
Hi Gary,
The gist of an OC curve to typically based on a judgement or conclusion that something or a batch of something is either good or not according to some criteria – independent of what kind of data – continuous or not. The set of results are pass/fail based at the end of the day.
And other than with binomial, you can also use the hypergeometric to calculate the curve https://lucas-accendo-site-speed.sprod01.rmkr.net/oc-curve-with-hypergeometric-method/
Cheers,
Fred
Thanks Fred, very clear, very helpful. I had not seen the calculation laid out that way before.