Accendo Reliability

Your Reliability Engineering Professional Development Site

  • Home
  • About
    • Contributors
  • Reliability.fm
    • Speaking Of Reliability
    • Rooted in Reliability: The Plant Performance Podcast
    • Quality during Design
    • Way of the Quality Warrior
    • Critical Talks
    • Dare to Know
    • Maintenance Disrupted
    • Metal Conversations
    • The Leadership Connection
    • Practical Reliability Podcast
    • Reliability Matters
    • Reliability it Matters
    • Maintenance Mavericks Podcast
    • Women in Maintenance
    • Accendo Reliability Webinar Series
  • Articles
    • CRE Preparation Notes
    • on Leadership & Career
      • Advanced Engineering Culture
      • Engineering Leadership
      • Managing in the 2000s
      • Product Development and Process Improvement
    • on Maintenance Reliability
      • Aasan Asset Management
      • AI & Predictive Maintenance
      • Asset Management in the Mining Industry
      • CMMS and Reliability
      • Conscious Asset
      • EAM & CMMS
      • Everyday RCM
      • History of Maintenance Management
      • Life Cycle Asset Management
      • Maintenance and Reliability
      • Maintenance Management
      • Plant Maintenance
      • Process Plant Reliability Engineering
      • ReliabilityXperience
      • RCM Blitz®
      • Rob’s Reliability Project
      • The Intelligent Transformer Blog
      • The People Side of Maintenance
      • The Reliability Mindset
    • on Product Reliability
      • Accelerated Reliability
      • Achieving the Benefits of Reliability
      • Apex Ridge
      • Metals Engineering and Product Reliability
      • Musings on Reliability and Maintenance Topics
      • Product Validation
      • Reliability Engineering Insights
      • Reliability in Emerging Technology
    • on Risk & Safety
      • CERM® Risk Insights
      • Equipment Risk and Reliability in Downhole Applications
      • Operational Risk Process Safety
    • on Systems Thinking
      • Communicating with FINESSE
      • The RCA
    • on Tools & Techniques
      • Big Data & Analytics
      • Experimental Design for NPD
      • Innovative Thinking in Reliability and Durability
      • Inside and Beyond HALT
      • Inside FMEA
      • Integral Concepts
      • Learning from Failures
      • Progress in Field Reliability?
      • R for Engineering
      • Reliability Engineering Using Python
      • Reliability Reflections
      • Testing 1 2 3
      • The Manufacturing Academy
  • eBooks
  • Resources
    • Accendo Authors
    • FMEA Resources
    • Feed Forward Publications
    • Openings
    • Books
    • Webinars
    • Journals
    • Higher Education
    • Podcasts
  • Courses
    • 14 Ways to Acquire Reliability Engineering Knowledge
    • Reliability Analysis Methods online course
    • Measurement System Assessment
    • SPC-Process Capability Course
    • Design of Experiments
    • Foundations of RCM online course
    • Quality during Design Journey
    • Reliability Engineering Statistics
    • Quality Engineering Statistics
    • An Introduction to Reliability Engineering
    • Reliability Engineering for Heavy Industry
    • An Introduction to Quality Engineering
    • Process Capability Analysis course
    • Root Cause Analysis and the 8D Corrective Action Process course
    • Return on Investment online course
    • CRE Preparation Online Course
    • Quondam Courses
  • Webinars
    • Upcoming Live Events
  • Calendar
    • Call for Papers Listing
    • Upcoming Webinars
    • Webinar Calendar
  • Login
    • Member Home

Big Data & Analytics

by Dennis Craggs Leave a Comment

Extended Bogy Testing

Extended Bogy Testing

Extended Bogy Testing

Introduction

Extended bogy testing builds on test to bogy (TTB), discussed in a prior article. TTB focused on calculating the number (N) of parts tested to one life bogy, with 0 failures allowed, to a specified reliability (R) and confidence (C) levels.

Using TTB to verify conformance to high reliability and confidence targets requires very large sample sizes, increasing testing cost. The capacity to test large samples may require large facility capital expenditures. Also, the zero failures allowed paradigm removes the opportunity to learn about product failure modes and the opportunity to improve the product through design or manufacturing process changes.

This article focuses on extended bogy test plans as an alternative to TTB.

[Read more…]

Filed Under: Articles, Big Data & Analytics, on Tools & Techniques

by Dennis Craggs 3 Comments

Test To Bogy Sample Sizes

Test To Bogy Sample Sizes

Test To Bogy Sample Sizes

Introduction

Reliability verification is a fundamental stage in the product development process. It is common for engineers to run a test to bogy (TTB).  What sample size is required for a TTB?

Reliability Testing

Reliability is the probability of a part successfully functions under specified life, duty cycle and environmental conditions. Many functions are specified during the design process. Each reliability test will be focused to validate a specific function. The targeted verification level depends on the criticality of the function and potential failure modes. The life could be specified as a count of cycles, an operating time, or perhaps a mileage or mileage equivalent. The duty cycle is a description of how the device is used. Environmental stresses are generally included in the test. 

[Read more…]

Filed Under: Articles, Big Data & Analytics, on Tools & Techniques

by Dennis Craggs 9 Comments

Sample Size – Measuring a Continuous Variable

Sample Size – Measuring a Continuous Variable

Sample Size – Measuring a Continuous Variable

Introduction

When planning a test on a continuous variable, the most common question was “How many should I test”? Later, when the test results were available, the questions were “What is the confidence?” or “How precise was the result?” This article focuses on planning the measurements of a continuous variable and analyzing the test results. 

[Read more…]

Filed Under: Articles, Big Data & Analytics, on Tools & Techniques

by Dennis Craggs Leave a Comment

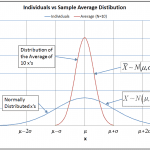
The Central Limit Theorem

The Central Limit Theorem

Introduction

In some of my articles, I have referred to The Central Limit Theorem, a development in probability theory. It can be stated

“When independent identically distributed random variables are added, their normalized sum tends toward a normal distribution (informally a “bell curve”) even if the original variables themselves are not normally distributed.”

We can apply this principle to many practical problems to analyze the distribution of the sample mean. In this article, I provide graphical and mathematical descriptions and a practical example.

[Read more…]

Filed Under: Articles, Big Data & Analytics, on Tools & Techniques

by Dennis Craggs Leave a Comment

Sample Sizes – Surveys

Sample Sizes – Surveys

Sample Sizes – Surveys

Introduction

How many responses are needed for a survey? This question requires specifying the desired confidence and the accuracy of the survey results.

The Bernoulli Trial

A Bernoulli trial is an event that has two possible outcomes. Consider the case where the only possible outcomes are success or failure. Let the probability of a success is p and the probability of failure equals q.  The probabilities of all possible events must equal 1, so q = 1-p. These relationships are expressed mathematically as 

[Read more…]

Filed Under: Articles, Big Data & Analytics, on Tools & Techniques

by Dennis Craggs 6 Comments

Process Capability VII – Confidence Limits

Process Capability VII – Confidence Limits

Introduction

In prior articles on process capability, sample statistics and SPC statistics were assumed to be population parameters and ignored sampling variability. This article reviews the analytic methods that can be used to develop confidence bounds on the process capability indices.

$-P_p-$ Index

The Pp index calculation requires an estimate of the parameter σ. The index is calculated as:

[Read more…]

Filed Under: Articles, Big Data & Analytics, on Tools & Techniques

by Dennis Craggs 3 Comments

Process Capability VI – Non-Normal Variables

Process Capability VI – Non-Normal Variables

The Situation

You have a process that is not capable because sample measurements or SPC data indicate that some characteristics have too much variability. The calculated Cpk’s are too small. What do you do?

Assuming the data is correct, a course of action is to review the assumption is that the measurements are normally distributed. For most situations, this is a reasonable assumption, but other statistical distributions may provide a better description of the data variation. 

[Read more…]

Filed Under: Articles, Big Data & Analytics, on Tools & Techniques

by Dennis Craggs Leave a Comment

Process Capability V – Variation Reduction

Process Capability V – Variation Reduction

Introduction

In the prior article, Process Capability IV, vehicle wheel toe alignment showed excessive variation. Because the vehicle assembly process is very long and involves many steps, the toe alignment problem required brainstorm which serial production steps, factors, and levels could be responsible for the variation. The most likely process steps were examined and the problem area identified as a wheel alignment machine that needed maintenance and calibration.

[Read more…]

Filed Under: Articles, Big Data & Analytics, on Tools & Techniques

by Dennis Craggs Leave a Comment

Telematic Analytics – Article Links

Telematic Analytics – Article Links

Telematics Analytics

This post provides a list of my telematics analytics articles, a short description and a link. The goal is to make it easy for the reader to locate any of the articles. It is recommended to read these articles in the order presented.  This post will be updated when additional posts are written on this topic.

[Read more…]

Filed Under: Articles, Big Data & Analytics, on Tools & Techniques

by Dennis Craggs Leave a Comment

Process Capability – Article Links

Process Capability – Article Links

Process Capability Articles

This post provides a list of my process capability articles, a short description and a link. The goal is to make it easy for the reader to locate any of the articles. It is recommended to read these articles in the order presented.  This post will be updated when additional posts are written on the Process Capability topic.

[Read more…]

Filed Under: Articles, Big Data & Analytics, on Tools & Techniques

by Dennis Craggs 2 Comments

Process Capability Analysis IV – Improve the Process

Process Capability Analysis IV – Improve the Process

In the article Process Capability I – Overview and Indices, the main process performance indices were defined. In the article Process Capability Analysis II – Estimating Percent Defective, ways to calculate the percent defective were introduced.

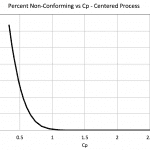
Next, a way to estimate estimate the percent defective was discussed in Process Capability III – Cp vs Percent Defective. The data showed the process had a  Cp ~0.46, so even if centered, a high percentage of parts would be non-conforming! In industry, it is common to see a Cp of about 1. The paradigm is that if the process range is just contained within the tolerance range, it is satisfactory.  Such processes are marginally capable. A process mean shift away from the target or an increase in variation significantly increases the number of non-conforming parts.  Process Capability needs to be increased. At a minimum, Cp should be greater than 1.33, but larger is better.

There are two approaches to improving process capability. One is to center the process and the other is to reduce variation. Both need to be accomplished.

[Read more…]

Filed Under: Articles, Big Data & Analytics, on Tools & Techniques

by Dennis Craggs 4 Comments

Process Capability Analysis III – Cp vs Percent Defectives

Process Capability Analysis III – Cp vs Percent Defectives

Introduction

In the article Process Capability I – Overview and Indices, the main process performance indices were defined. In the article Process Capability Analysis II – Estimating Percent Defective, ways to calculate the percent defective were introduced.

In this article, the mathematical connection between the Cp index and percent defectives is made.

[Read more…]

Filed Under: Articles, Big Data & Analytics, on Tools & Techniques Tagged With: Cp, Cpk, Pp, Ppk, Process Capability

by Dennis Craggs 2 Comments

Process Capability Analysis II – Percent Defective Estimates

Process Capability Analysis II – Percent Defective Estimates

Introduction

In my prior article, Process Capability I – Overview and Indices, the process capability concept was defined for prototype samples and serial production. The data is assumed to be normally distributed and Pp, Ppk, Cp, and Cpk indices were defined. Its application to one-sided and two-sided tolerances was discussed. This article provides methods to estimate the percent defective.

The Data

The engineering tolerance for a critical characteristic is 10±0.2. So the lower specification limit (LSL) is 9.8 and the upper specification limit (USL) is 10.2. A sample of 30 parts provided measurements of the critical characteristic. The sample mean ($-\bar{x}-$) was 9.951 and the sample standard deviation (s) was 0.1825.

[Read more…]

Filed Under: Articles, Big Data & Analytics, on Tools & Techniques

by Dennis Craggs 4 Comments

Process Capability Analysis I – Overview and Indices

Process Capability Analysis I – Overview and Indices

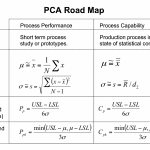
Introduction

How is a manufacturing process determined to be capable of producing parts that meet engineering requirements? Some, like the finish of a gear tooth are critical, while the roughness of a non-contact surface isn’t critical. The critical characteristics need to be identified and checked to determine if the process is capable.

This article defines the analysis concepts and indices.

Prototypes and Series Production

Process capability assessments (PCA) start during the product development process and continue into series production. Prototype parts are created by a variety of methods, ranging from hand-crafted parts to short term manufacturing in a production intent process under factory conditions. The methods that are closest to series production are the most realistic.

[Read more…]

Filed Under: Articles, Big Data & Analytics, on Tools & Techniques Tagged With: Cp, Cpk, data analysis, Pp, Ppk, Process Capability

by Dennis Craggs Leave a Comment

Telematics Data – Contour Plots and Multiple Parameter Analysis

Telematics Data – Contour Plots and Multiple Parameter Analysis

Introduction

The analysis of telematics data with two or more parameters is a complex process. The analysis of multiple parameters using contour plots is a powerful tool since a lot of information is captured in the graphics.

The best results come from a team effort. For engineering data, the team may consist of the design/development engineers, a programmer, and a reliability engineer or a statistician. The following is an analysis of engine speed, engine torque, and the transmission gear state to describe the process.

[Read more…]

Filed Under: Articles, Big Data & Analytics, on Tools & Techniques

  • « Previous Page
  • 1
  • 2
  • 3
  • Next Page »
Big Data & Analytics series Article by Dennis Craggs

Join Accendo

Receive information and updates about articles and many other resources offered by Accendo Reliability by becoming a member.

It’s free and only takes a minute.

Join Today

Recent Articles

  • test
  • test
  • test
  • Your Most Important Business Equation
  • Your Suppliers Can Be a Risk to Your Project

© 2025 FMS Reliability · Privacy Policy · Terms of Service · Cookies Policy