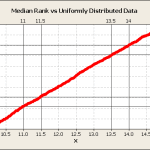
In my prior article, “A Primer on Probability Distributions”, the usage of different types of histograms to display data was discussed. The histogram would acquire a bell shape if the data were normally distributed. The main limitation of the histogram approach is that the shape of the histogram can change radically with the selection of the bins used. Instead, a probability plot could be used.
This article discussed probability plots. They are extremely useful for the analysis of big and small data sets.
