Frequently, data collection is the most time consuming and expensive part of a project. Consequently, people work with small sample data. There is too little data to plot a histogram, so the analysis assumes the underlying population is normally distributed.
A frequent error is to assume the sample average and standard deviation are the population normal mean and standard deviation. When small sample sizes are being analyzed, these assumptions lead to estimation errors.
Methods to make better estimates are discussed in this article.
The Data
If we have a sample of 5 measurements with an average of 100.08 and standard deviation of 2.75. Then how do we estimate confidence limits on the population mean $-\mu-$, confidence limits on the population standard deviation $-\sigma-$, and the statistical tolerance limits?
Confidence Limits on the Population Mean
The sample average is not the mean. Successive groups of measurements will have different sample averages and thus exhibit variation about the mean. In statistics, it can be proved that the averages drawn from a normally distributed random variable are themselves normally distributed. Therefore, rather than using a sample average, it is better to calculate confidence limits on the mean. Some use the normal distribution to calculate these limits. The problem is that the population standard deviation, $-\sigma-$, is unknown. It can be shown that difference between the population mean and the sample mean divided by the mean standard deviation follows the t-distribution, i.e.,
$$\frac{\bar{x}-\mu}{s/\sqrt{n}}{\sim}t(\nu)$$
(1)
where $-\nu=n-1-$, the degrees of freedom. Also, the $-\sim-$ symbol means “is distributed as”.
The t-distributions are a family of distributions differentiated by degrees of freedom. With increasing degrees of freedom, the t-distribution family approaches the normal distribution as shown in figure 1,
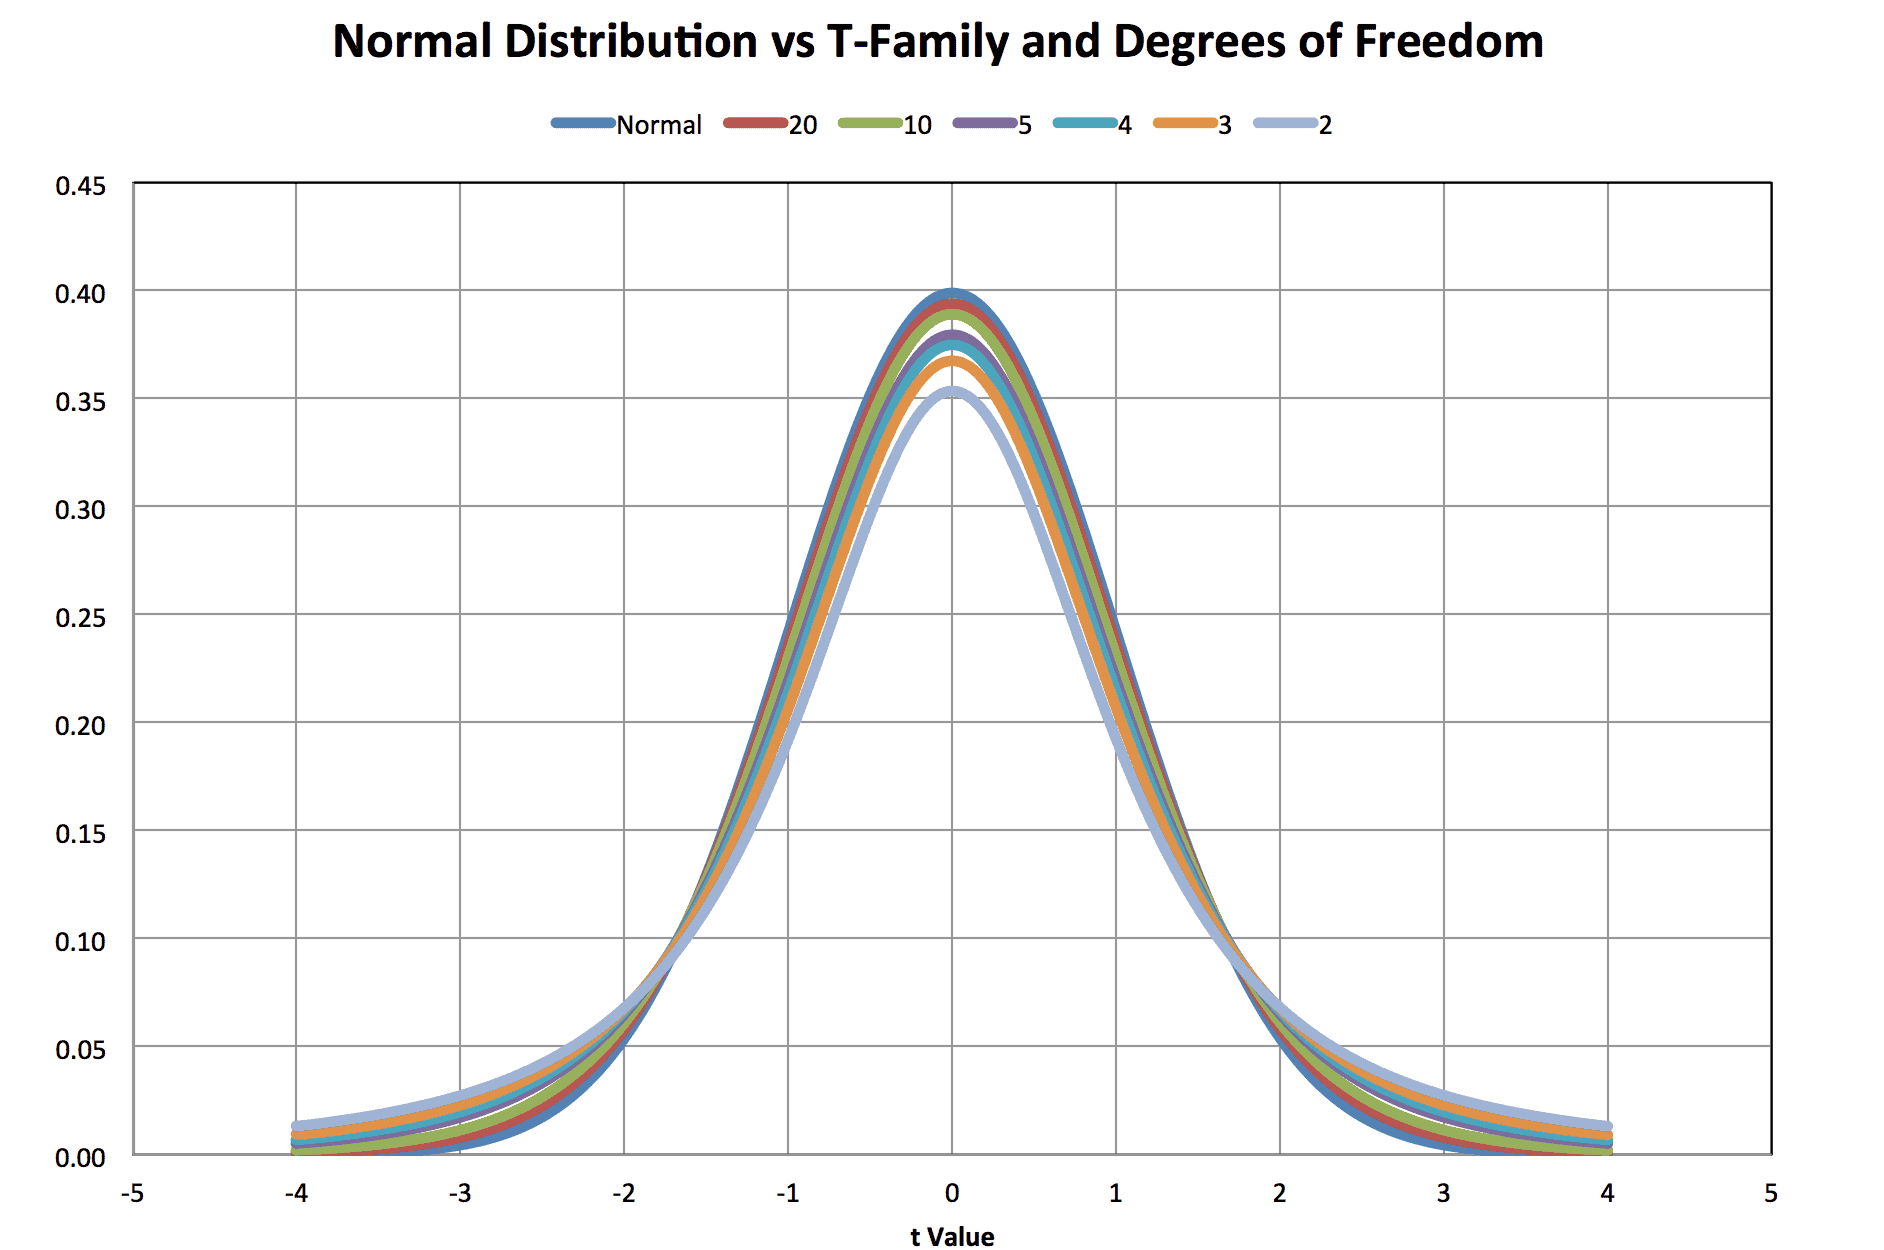
Figure 1
The curve shows t-distributions for degrees of freedom of 2, 3, 4, 5, 10, and 20 vs. the normal distribution. The t-distributions are symmetric so the probability density at t is equal to the probability density at –t. Note that below 20 degrees of freedom, the divergence from the normal is visually significant. In general, when compared to the normal distribution, the t-distributions are flatter. The center probability densities are lower and the tail probability densities are higher.
Let’s assume a confidence C=90% for our estimate of $-\mu-$. The probability of error is $-\alpha=1-C=0.1-$ and would be split equally between the upper and lower tails of the distribution. The general equation to calculate two-sided limits on the mean is equation 2,
$$\bar x + t_{\alpha/2,n-1}s/\sqrt{n}\lt\mu\lt\bar x + t_{1-\alpha/2,n-1}s/\sqrt{n}$$
(2)
The notation deserves some explanation. The t-subscripts indicate a cumulative probability and the degrees of freedom in the problem. This equation assumes the usage of a table of t-distribution cumulative percentiles, i.e., the lower tail, for different t-values. Alternatively, the t-value could come from the Excel function T.INV, which provides the t-value for a cumulative probability P with specified degrees of freedom. When P is less than 0.5, the t-values are negative.
With 5 samples and a 90% confidence is desired, $-t_{0.05,4}=-2.132-$. Using $-\bar x=100.08-$ and s= 2.75, then the 90% confidence interval on the normal mean is (97.46,102.70).
Confidence Limits on the Population Standard Deviation
A similar problem occurs estimating the population standard deviation, $-\sigma-$, using the sample size and the sample standard deviation, s. It can be shown that the degrees of freedom, $-\nu-$, times the square of the sample standard deviation ($-S^2-$), and divided by the population standard deviation follows a Chi-Square distribution with $-\nu=n-1-$ degrees of freedom, formula 3:
$$(n-1)s^2/\sigma^2\sim\chi^2(\nu)$$
(3)
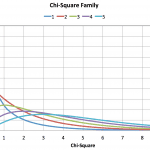
A plot for 1, 2, 3, 4, and 5 degrees of freedom is shown in figure 2.
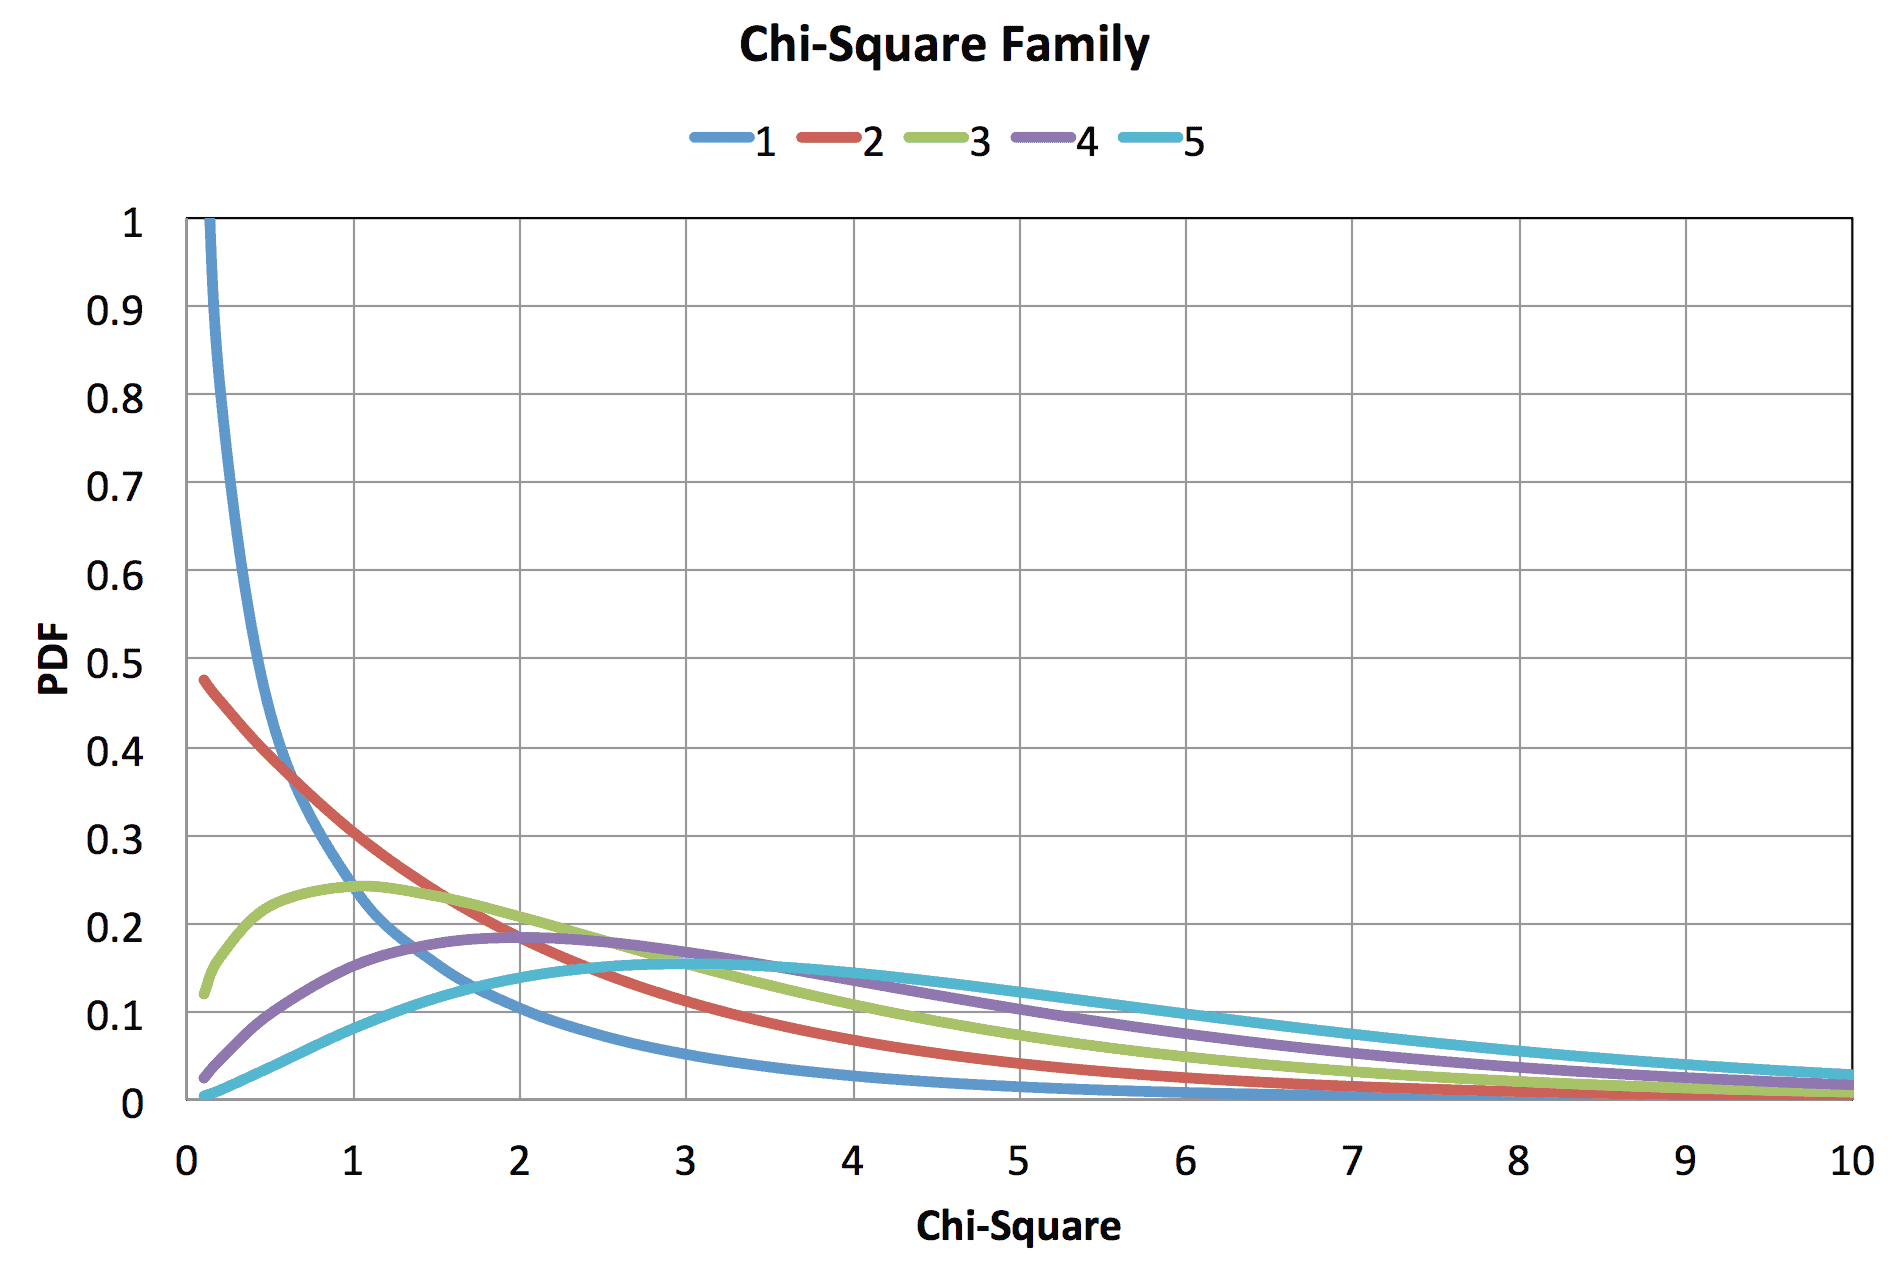
Figure 2
Note that the Chi-Square family pdf is skewed to the right and therefore not symmetric. Two-sided limits on s may be calculated using formula 4,
$$s\sqrt{(n-1)/\chi_{1-\alpha/2,n-1}^2}\lt\sigma\lt{s\sqrt{(n-1)/\chi_{\alpha/2,n-1}^2}}$$
(4)
Using a left-sided cumulative $-\chi^2-$ probability table and a sample size of 5, then $-\chi^2_{0.05,4}=0.711-$ and $-\chi^2_{0.95,4}=11.14-$. Substituting the sample standard deviation, the limits on the population standard deviation are (1.65,6.52). Note that while the sample standard deviation was 2.75, the population standard deviation could be as large as 6.52, a very large difference.
Tolerance Limits on the Population
Tolerance limits cannot be directly calculated using the normal distribution table. The normal table assumes that we know $-\mu-$ and $-\sigma-$. Calculating tolerance limits on a normal population from test statistics should use a non-central t-distribution. The theory is rather involved, but factors for one-sided and two-sided tolerance limits containing P% of the population with C% confidence are documented in Tables A6 and A7 of Experimental Statistics Handbook 91, United States Department of Commerce, National Bureau of Standards. One may select 75%, 90%, 95% and 99% confidence values for 75%, 90%, 95%, 99%, and 99.9% populations. Test sample sizes range from 2 to 1000. Other sources are available.
For two-sided tolerance limits, define LL as the lower limit and UL as the upper limit. Then use equations 5 and 6 and the two-sided table A6.
$$LL=\bar{x}-ks$$
(5)
$$UL=\bar{x}+ks$$
(6)
The factor k is sometimes called the k-factor.
If calculating a one-sided lower tolerance limit, use equation 5 and table A7 for the k-factor. Alternatively, if calculating a one-sided upper tolerance limit, use equation 6 and table A7 for the k-factor.
For the sample problem, let’s calculate the two-sided 99.9% tolerance limit at 90% confidence. From table A6, k=6.875, therefore, the tolerance limits are (81.17, 118.99). If the sample average ±3 sigma were used, then the limits of (91.83,108.33) would underestimate the tolerance limits. The k-factor approach is more accurate as it considers the variability in both the sample mean and standard deviation.
Conclusions
- The t-distribution is symmetric and provides statistical estimates of the population mean.
- The Chi-square distribution is right skewed and provides statistical estimates of the population standard deviation.
- K-factors based on the non-central t-distribution compensate for sample variation and provide statistically valid estimates of the population spread.
If you have any questions on this material, please ask in the feedback section. I promise to get back to you.
Dennis Craggs
810-964-1529
dlcraggs@me.com
Hello, I visited the online statistics handbook referenced, but I do not see the tables that are mentioned. Instead there are equations for tolerance factor k. I am writing an article that will reference your article as well as the online handbook, but if there are tables still available I’d like to provide a specific link to those. Do you mind pointing me in the right direction?
Thank you so much,
Arin Holecek
I was using my personal copy of the handbook. However, anybody can purchase a copy on line from Amazon or other sources. To see a scanned image of the publication, follow this link: Experimental Statistics Manual 91
You browser window should show a table A-6, pages 446 and 447. Then, use the right arrow to shift the display to display the remaining pages of table A-6, pages 448 and 449. Right shift again to display table A-7, pages 450 and 451. Depending on your display, the table is very readable. To maximize the size use the button at the lower right.
Thank you so much! I love your website! Many statistical subjects are elucidated beautifully.