Accendo Reliability

Your Reliability Engineering Professional Development Site

  • Home
  • About
    • Contributors
  • Reliability.fm
    • Speaking Of Reliability
    • Rooted in Reliability: The Plant Performance Podcast
    • Quality during Design
    • Way of the Quality Warrior
    • Critical Talks
    • Dare to Know
    • Maintenance Disrupted
    • Metal Conversations
    • The Leadership Connection
    • Practical Reliability Podcast
    • Reliability Matters
    • Reliability it Matters
    • Maintenance Mavericks Podcast
    • Women in Maintenance
    • Accendo Reliability Webinar Series
  • Articles
    • CRE Preparation Notes
    • on Leadership & Career
      • Advanced Engineering Culture
      • Engineering Leadership
      • Managing in the 2000s
      • Product Development and Process Improvement
    • on Maintenance Reliability
      • Aasan Asset Management
      • AI & Predictive Maintenance
      • Asset Management in the Mining Industry
      • CMMS and Reliability
      • Conscious Asset
      • EAM & CMMS
      • Everyday RCM
      • History of Maintenance Management
      • Life Cycle Asset Management
      • Maintenance and Reliability
      • Maintenance Management
      • Plant Maintenance
      • Process Plant Reliability Engineering
      • ReliabilityXperience
      • RCM Blitz®
      • Rob’s Reliability Project
      • The Intelligent Transformer Blog
      • The People Side of Maintenance
      • The Reliability Mindset
    • on Product Reliability
      • Accelerated Reliability
      • Achieving the Benefits of Reliability
      • Apex Ridge
      • Metals Engineering and Product Reliability
      • Musings on Reliability and Maintenance Topics
      • Product Validation
      • Reliability Engineering Insights
      • Reliability in Emerging Technology
    • on Risk & Safety
      • CERM® Risk Insights
      • Equipment Risk and Reliability in Downhole Applications
      • Operational Risk Process Safety
    • on Systems Thinking
      • Communicating with FINESSE
      • The RCA
    • on Tools & Techniques
      • Big Data & Analytics
      • Experimental Design for NPD
      • Innovative Thinking in Reliability and Durability
      • Inside and Beyond HALT
      • Inside FMEA
      • Integral Concepts
      • Learning from Failures
      • Progress in Field Reliability?
      • R for Engineering
      • Reliability Engineering Using Python
      • Reliability Reflections
      • Testing 1 2 3
      • The Manufacturing Academy
  • eBooks
  • Resources
    • Accendo Authors
    • FMEA Resources
    • Feed Forward Publications
    • Openings
    • Books
    • Webinars
    • Journals
    • Higher Education
    • Podcasts
  • Courses
    • 14 Ways to Acquire Reliability Engineering Knowledge
    • Reliability Analysis Methods online course
    • Measurement System Assessment
    • SPC-Process Capability Course
    • Design of Experiments
    • Foundations of RCM online course
    • Quality during Design Journey
    • Reliability Engineering Statistics
    • Quality Engineering Statistics
    • An Introduction to Reliability Engineering
    • Reliability Engineering for Heavy Industry
    • An Introduction to Quality Engineering
    • Process Capability Analysis course
    • Root Cause Analysis and the 8D Corrective Action Process course
    • Return on Investment online course
    • CRE Preparation Online Course
    • Quondam Courses
  • Webinars
    • Upcoming Live Events
  • Calendar
    • Call for Papers Listing
    • Upcoming Webinars
    • Webinar Calendar
  • Login
    • Member Home

by nomtbf Leave a Comment

Plot the Data

Plot the Data

Plot the Data

Just, please, plot the data.

If you have gathered some time to failure data. You have the breakdown dates for a piece of equipment. You review your car maintenance records and notes the dates of repairs. You may have some data from field returns. You have a group of numbers and you need to make some sense of it.

Take the average

That seems like a great first step. Let’s just summarize the data in some fashion. So, let’s day I have the number of hours each fan motor ran before failure. I can tally up the hours, TT, and divide by the number of failures, r. This is the mean time to failure.

$latex \displaystyle&s=3 \theta =\frac{TT}{r}$

Or, if the data was one my car and I have the days between failures, I can also tally up the time, TT, and divide by the number of repairs, r. Same formula and we call the result, the mean time between failure.

And I have a number. Say it’s 34,860 hours MTBF. What does that mean (no pun intended) other than on average my car operated for 34k hours between failures. Sometimes more, sometimes less.

Any pattern? Is my car getting better with age, or worse?

A Histogram

In school we used to use histograms to display the data. Let’s try that. Here’s an example plot.
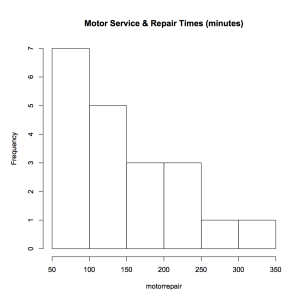
 

Screen Shot 2015-08-05 at 8.01.58 AM In this case the plot is of service and repair times (most likely similar to the times the garage has my car for a oil change and tune up). Right away we see more than just a number. The values range from about 50 up to about 350 with most of the data on the lower side. Just a couple of service times take over 250 minutes.

Using just an average doesn’t provide very much information compared to a histogram.

Mean Cumulative Function Plot

Over time count the number of failures. If the repair time is short compared to operating time, than this simple plot may reveal interesting patterns that a histogram cannot.

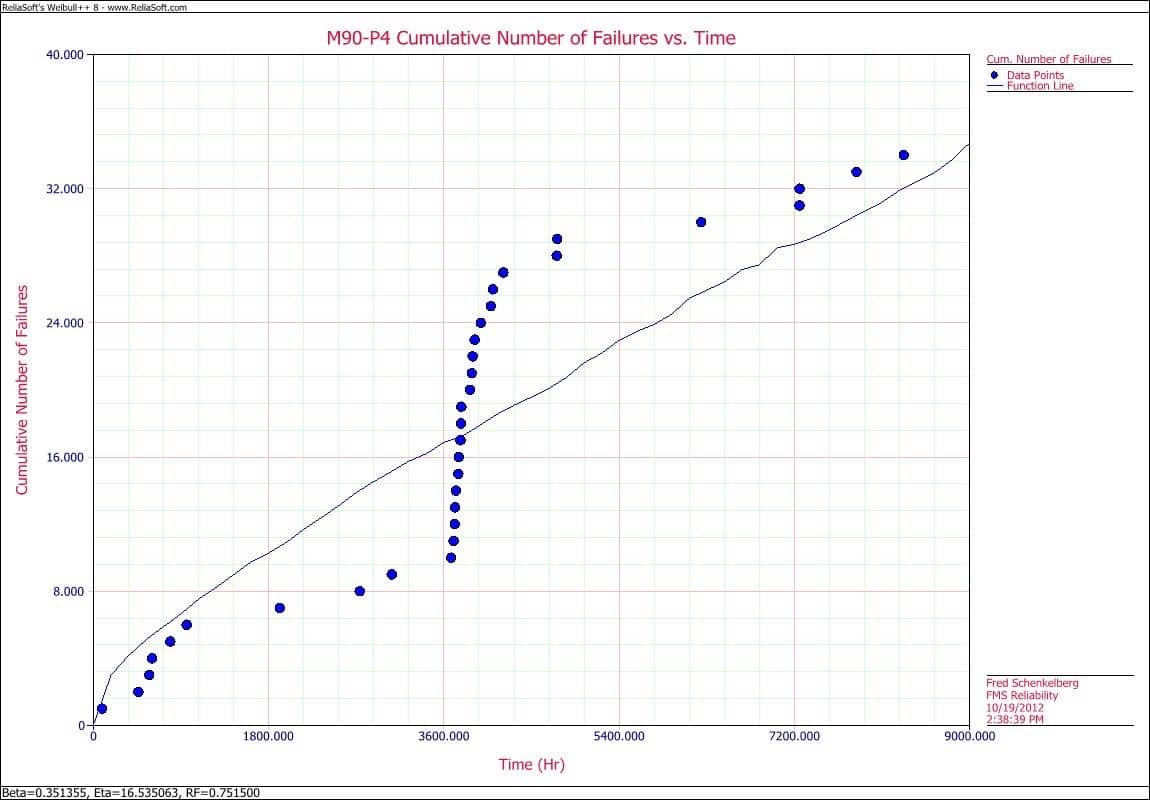
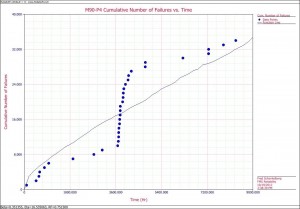
Here is a piece of equipment and each dot represented a call for service. The x-axis is time and the vertical axis is the count of service calls. While it’s not clear what happened shortly after about 3,000 hours, it may be worth learning more about what was going on then.

M90-P4 MCF


Even after the first there or four point after 3,000 hours would have signaled something different is happening here.
MCF plots show when something is getting worse (more frequent repairs) by curving upward, or getting better, (longer spans between repairs) by flattening out. Again, a lot more information than with just a number.

Plot the Fitted Distribution

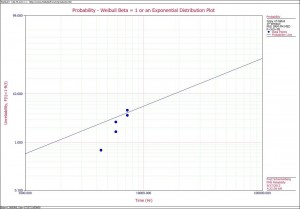
Let’s say we really want to assume the data is from an exponential distribution. We can happily calculate the MTBF value and continue with the day. Or, we can plot the data and the fitted exponential distribution.

Let’s say we have about five failure times based on customer returns out of the 100 units placed into service. We can calculate the MTBF value including the time the remaining 95 units operated, which is about 172,572 hours MTBF. And, we can plot the data, too.

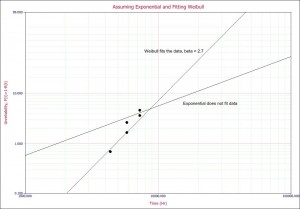
Here’s an example. What do you notice, even with a fuzzy plot image?

Exp assumed plot


The line intersects the point where the F(t) is 0.63 or about the 63rd percentile of the distribution, and the time is at the point we calculated as the MTBF value (off to the right of the plot area).
Like me, you may notice the line doesn’t seem to describe the data very well. It seems to have a different pattern than that described by the exponential distribution. Let’s add a fit of a Weibull distribution that also was fit to the data, including the units that have not failed.


W v E plot

The Weibull fit at least appears to represent the pattern of the failures. The slope is much steeper than the exponential fit. The Weibull tells a different story. A story that represents the story within the data.

Again, just plot the data. Let the data show you what it has to say. What does your data say today?
Filed Under: Articles, NoMTBF

« Chance of Catching a Shift in a Control Chart
Reliability Specifications and Requirements »

Leave a Reply Cancel reply

Your email address will not be published. Required fields are marked *

[popup type="" link_text="Get Weekly Email Updates" link_class="button" ]

[/popup]

The Accendo Reliablity logo of a sun face in circuit

Please login to have full access.


Lost Password? Click here to have it emailed to you.

Not already a member? It's free and takes only a moment to create an account with your email only.

Join

Your membership brings you all these free resources:

  • Live, monthly reliability webinars & recordings
  • eBooks: Finding Value and Reliability Maturity
  • How To articles & insights
  • Podcasts & additional information within podcast show notes
  • Podcast suggestion box to send us a question or topic for a future episode
  • Course (some with a fee)
  • Largest reliability events calendar
  • Course on a range of topics - coming soon
  • Master reliability classes - coming soon
  • Basic tutorial articles - coming soon
  • With more in the works just for members
Speaking of Reliability podcast logo

Subscribe and enjoy every episode

RSS
iTunes
Stitcher

Join Accendo

Receive information and updates about podcasts and many other resources offered by Accendo Reliability by becoming a member.

It’s free and only takes a minute.

Join Today

Dare to Know podcast logo

Subscribe and enjoy every episode

RSS
iTunes
Stitcher

Join Accendo

Receive information and updates about podcasts and many other resources offered by Accendo Reliability by becoming a member.

It’s free and only takes a minute.

Join Today

Accendo Reliability Webinar Series podcast logo

Subscribe and enjoy every episode

RSS
iTunes
Stitcher

Join Accendo

Receive information and updates about podcasts and many other resources offered by Accendo Reliability by becoming a member.

It’s free and only takes a minute.

Join Today

Recent Articles

  • test
  • test
  • test
  • Your Most Important Business Equation
  • Your Suppliers Can Be a Risk to Your Project

© 2025 FMS Reliability · Privacy Policy · Terms of Service · Cookies Policy