
Introduction
In the article Process Capability I – Overview and Indices, the main process performance indices were defined. In the article Process Capability Analysis II – Estimating Percent Defective, ways to calculate the percent defective were introduced.
In this article, the mathematical connection between the Cp index and percent defectives is made.
The Data
Let’s start with the same data used in “PCA II”. The engineering tolerance for a critical characteristic is 10±0.2. So the lower specification limit (LSL) is 9.8 and the upper specification limit (USL) is 10.2.
Production parts provided measurements for the critical characteristic. The process had an average of 9.951 with a standard deviation of 0.1825.
The sample data process average was slightly low at 9.951. Adjusting the process average is generally easy to accomplish. An adjustment may be simply a control change or a more complex set-up. For our example, let’s assume the process average is adjusted to produce parts at 10.
Reducing variation is more difficult so let’s assume the standard deviation remains at 0.1825.
Indices
The Cp index value of (10.2 – 9.8)/(6*0.1825)=0.37 indicates a non-capable process, i.e., the critical characteristic distribution, i.e., 6s, is broader than the tolerance width. In this situation, process centering yields the fewest non-conformances. Capable processes must have Cp>1.0! While quality targets are a management activity, many manufacturing companies target at Cp≥1.33. Six Sigma practitioners generally target Cp≥2.0.
Percent Defectives
In Excel, the percent below the LSL is 0.1366, or 13.66%, equation 1.
$$P(X<9.8)=norm.dist(9.8,10,0.1825,true)=0.1366$$
(1)
The percent above the USL is slightly more complicated. The percent below the USL is 0.8634, or 86.34%, equation 2.
$$P(X<10.2)=norm.dist(10.2,10,0.1825,true)=0.8634$$
(2)
What is needed is the percent above the USL. This is calculated by subtracting the result of equation 2 from 1 yielding 0.1366, or 13.66%, equation 3.
$$ P(X>USL)=1-P(X<LSL)=0.1366$$
(3)
There is a slight approximation in this equation. It ignores the theoretical probability that X=USL, which is infinitely small.
So the total percent nonconforming is about 0.274, or approximately 27%. For this centered process, if the process variation can be reduced, then the percent non-conforming decreases and the Cp index increases, figure 1.

Figure 1
Figure 1 shows that to reduce the non-conforming percent, the Cp has to exceed 1. Figure 1 does not have enough resolution to show the percent defective for Cp>1, but table 1 should help.
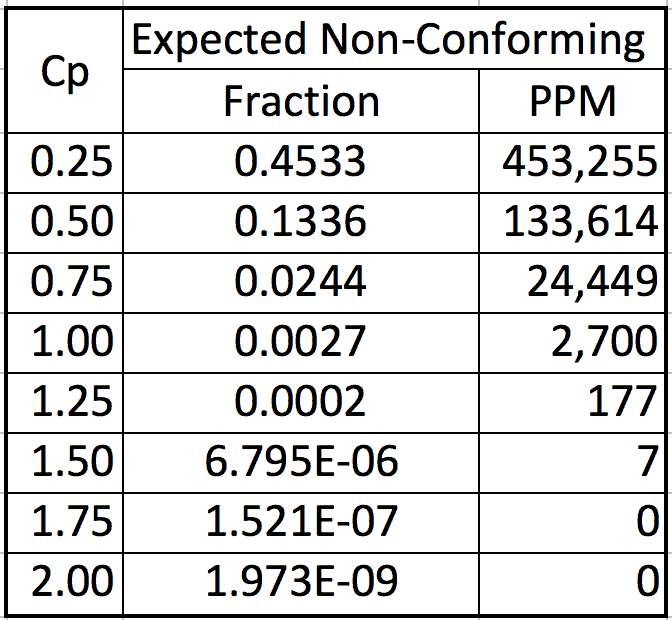
Table 1
Table 1 shows the non-conforming parts for a stable centered normally distributed process is about 2,700 ppm when the Cp=1. In a competitive business climate, 2,700 ppm non-conforming is too high for critical characteristics that affect appearance, fit, function, reliability, and safety. The cost of a single safety lawsuit or recall action may exceed the profit made from millions of conforming parts.
When the process is not centered, then the non-conforming percent will exceed the values in table 1. Because of these concerns, groups like the Six Sigma consultants strive to achieve a Cp≥2.0! This approach allows the process center to deviate approximately ±1s from the engineering target.
Multiple Critical Characteristics
Most manufactured parts have multiple independent critical characteristics. Assume there are N critical characteristics and the processes are centered. If the characteristics mutually independent, then an estimate of the total percent defective, P, can be developed from a series reliability model, equation 4.
$$P=1-\prod_{i=1}^{i=N}(1-p_i)$$
(4)
Here pi is the expected percent defective for the ith critical characteristic. If the pi values are small then the percent non-conforming may be calculated, equation 5
$$P=\sum_{i=1}^{i=N}p_i$$
(5)
For example, assume that a part has 10 critical characteristics (N=10) and the desired percent defective in the process should be less than 1 in 1,000,000, or P=10-6. Let the pi’s equal p, then p≤P/N. So, p≤10-7! To achieve this value of p, Cp≥ 1.77 would be required.
Conclusions
The modern competitive environment requires high quality parts, manufactured by a process, with multiple critical characteristics that conform to engineering requirements. The manufacturing process needs to be stable and in statistical control. To minimize defects, a process producing parts with a normally distributed characteristic, needs to be centered at the average of the two-sided tolerance specification. If the process capability indices are monitored, management and/or engineering will have a corporate objective for each index. A Six Sigma compliant organization will target $-C_{pk}\leq2-$. This means the process variation is about half of the allowed engineering tolerance.
Next
If a process is not capable, it is necessary to improved the process. This can be done by centering the process and/or by reducing the process variation. A discussion of this is in the next article Process Capability IV – Improve the Process.
Note
Do you have manufacturing and design problems? I worked for 30 years solving design engineering and manufacturing problems by applying Quality, Reliability, Applied Statistics, and Data Analytics. If you want to engage me on this or other topics, please contact me. I taught undergraduate statistics; reliability and robust design at the graduate level. I provide Minitab seminars to corporate clients, write articles, and have presented and written papers at SAE, ISSAT, and ASQ. When software tools are not available to support the analysis process, I write custom software for the job.
Dennis Craggs, Consultant
Quality, Reliability and Analytics Services
810-964-1529
dlcraggs@me.com
Very interestimg Fred, a easy way to explain and understand the real Cpk concept traduced in ppm.
Sometimes Supplier’s Quality and R&D colleagues understand better the concept of ppm and the cost of this ppm in the market than the Cpk value.
Thank you for your articles!
Thanks! I appreciate the feedback on my articles. I plan some more in the series on Process Capability Analysis.
Dennis Craggs of
Dennis L Craggs, LLC
Very nice.
One comment, when calculating Eq. 4, be careful, this form is sensitive to the finite computing accuracy.
Thanks.
Yes. That is why I followed up with equation 5, which is a reasonable and more direct calculation that can be used when the probabilities (Pi) are small. Of course, if any Pi is large there is a more major issue to be resolved.