In the article Process Capability I – Overview and Indices, the main process performance indices were defined. In the article Process Capability Analysis II – Estimating Percent Defective, ways to calculate the percent defective were introduced.
Next, a way to estimate estimate the percent defective was discussed in Process Capability III – Cp vs Percent Defective. The data showed the process had a Cp ~0.46, so even if centered, a high percentage of parts would be non-conforming! In industry, it is common to see a Cp of about 1. The paradigm is that if the process range is just contained within the tolerance range, it is satisfactory. Such processes are marginally capable. A process mean shift away from the target or an increase in variation significantly increases the number of non-conforming parts. Process Capability needs to be increased. At a minimum, Cp should be greater than 1.33, but larger is better.
There are two approaches to improving process capability. One is to center the process and the other is to reduce variation. Both need to be accomplished.
Process Centering
The easiest action is to center the process. Most manufacturing operations have controls that adjust the process average. For example, in stamping operations, dies may be shimmed or retooled. In electronics manufacturing, solder paste is applied to a printed circuit board using a solder mask and the mask can be changed. Pick-and-place machines, which install components on circuit boards, can be reprogramed to correctly place parts on the board. In manufacturing, the torque guns used in a process may be adjusted by varying pneumatic pressure or, if electronically controlled, reprogrammed to a different target.
If changes occur which shift the process center over time, then process controls will need to be adjusted. Once the center is achieved, only authorized personnel should be allowed to adjust the process.
Reduce Variation
If the process variation is exceeds the allowed tolerance, then the process will never be capable. To reduce variation, sources of variation need to be identified.
When a process is not capable, one approach is to create a team composed of the design and manufacturing engineers. The team plans process improvement actions, execute, measure and analyze, and implement improvements. This is the Deming PDCA process, i.e., plan, do, check, act.
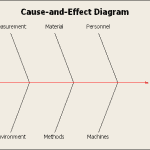
First, brainstorm the potential causes of variation. Organize the results into an Ishikawa Diagram; also known as a Fishbone Diagram or Cause and Effect (CE) Diagram. A CE diagram without factor definitions is shown in figure 1.

Figure 1
The CE Diagram organizes the potential causes of variation into measurements, materials, methods, tools, people, and environment categories. For manufacturing operations, most potential causes of variation will fall into one of the categories.
The potential causes are added as sub-branches to the main branches. This may make the CE diagram very busy. It may be necessary to add subcategories to the sub-branches. At the lowest level, the continuous variables and factor levels provide targets for investigation.
The data may be categorized into groups for analysis of selected the factors and levels. In the simplest procedure, one factor is selected. Then the groups is analyzed to determine if the factor levels are statistically significant differences.
Another approach is to conduct a design of experiment on multiple factors simultaneously.
Single Factor Analysis
I was a wheel alignment product design engineer during a new product launch. Measuring wheel alignment is a time consuming process so eight vehicles were measured per shift. During a preproduction run, all wheel alignment variables were in specification. However, during the actual product launch, the “toe” alignment of the front tires showed excessive variation. A plan view of toe alignment is shown and defined in figure 2.

Figure 2
The above graphic shows a toe-out situation. A person can look down at their feet and note the direction the toes of the foot are pointed. Toe is set near the end of an assembly line.
Team brainstorming produces a list of factors to be investigated. There are many factors that can affect setting the toe. Fortunately, vehicle wheel alignment audit data with the vehicle identification was stored in a database. When combined with vehicle build information the data could be correlated to vehicle type, engine size, day and shift of production, tools used, and other factors. For wheel alignment, a short list of the potential factors is shown in figure 3.

Figure 3
The team focused on different factor levels. For example, different types of vehicles were being produced sedans and station wagons. There were different engine sized were considered. The tires were sourced to different manufacturers. Similarly, there were different tire sizes. There was a day and a night shift.
Some factors occur in parallel, one was the side of the vehicle, i.e., left and right. Because of the size of an automobile, the tools and personnel are similar, but not identical from side to side.
During the analysis, the factors levels were used to stratify the alignment data into groups. The statistics, and s, for each group would be determined. Then hypothesis tests could be used to determine if the groups were significantly different in their process means or variances.
Most factors level differences were not statistically significant. However, the average toe setting for a machine was statistically different from the others. During the production trail run, one toe machine was used. The others were not used until serial production. One machine needed maintenance and calibration to produce parts in specification. This was accomplished and the toe process became capable.
Design of Experiments
Frequently, excessive variation occurs at a single process. Brainstorming can identify many sources of variation for a single process step. The traditional way to improve the process is by adjusting the settings one factor at a time. This is time consuming and inefficient.
DOE methods work better. They are a structured approach to analyze sources of variation, but require control and discipline. They yield the greatest potential for improving process capability by reducing variation. Future articles will address the DOE methods.
Conclusion
- Centering a process to engineering specifications minimizes defects.
- Reducing variation is frequently required to achieve a capable process.
- Brainstorm factors and levels that may produce variation and capture the results in a CE diagram.
- Separate the data by factor and levels can provide statistics to determine their significance. Actions on these groups can yield process improvements.
Note
Do you have manufacturing and design problems? I worked for 30 years solving design engineering and manufacturing problems by applying Quality, Reliability, Applied Statistics, and Data Analytics. If you want to engage me on this or other topics, please contact me. I taught undergraduate statistics; reliability and robust design at the graduate level. I provide Minitab seminars to corporate clients, write articles, and have presented and written papers at SAE, ISSAT, and ASQ. When software tools are not available to support the analysis process, I write custom software for the job.
Dennis Craggs, Consultant
Quality, Reliability and Analytics Services
810-964-1529
dlcraggs@me.com
It would nice to embed links for all related articles. Here are links to previous three articles in this series to save search time.
https://lucas-accendo-site-speed.sprod01.rmkr.net/process-capability-analysis-i/
https://lucas-accendo-site-speed.sprod01.rmkr.net/process-capability-analysis-ii/#more-163530
https://lucas-accendo-site-speed.sprod01.rmkr.net/process-capability-analysis-iii/
I have a summary article with all related links. Please check https://lucas-accendo-site-speed.sprod01.rmkr.net/process-capability-2/