First the Question:
Fred,
Early in the FMEA lecture you worked through a homework problem and you mentioned that a cdf may not be linear (hence the reason for giving three points in a reliability goal). Can you give an example of two of things you’ve seen with non-linear cdf’s? I’ve only done limited reliability testing at this point, but everything I’ve done and every example I’ve ever seen have had linear cdf’s.
Thanks,
John
And, my response:
Hi John,
Good question and one that I certainly can expand on a bit.
In general, a CDF plot is on axis scales that render the fit to appear as a straight line. Think Normal probably plotting paper (not quite log scales, yet the plotted line is straight if the fit is a Normal distribution. The same applies for Weibull, lognormal, exponential, etc. If the scales are set up appropriately, the fitted line should be straight if the data is described by that particular distribution.
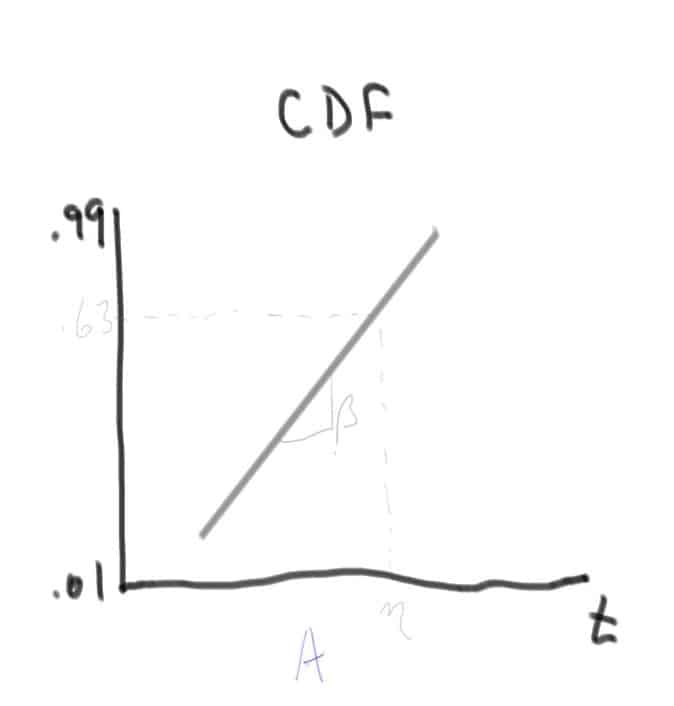
 Plot A (CDF indicators1.jpeg) is a representation of a Weibull or related CDF. The vertical axis is logarithmic and here from 0.1 to 0.99 and represent the cumulative probability of failure. All units start at time, t, zero and are working, as time goes by the units fail till all have failed. So, one way to read this plot is to ask when will 63% of the units have failed? Enter at 0.63 across to the fitted line and down to time to read the answer, in this case, eta. The slope of the line, beta, along with eta provide the two parameters needed to describe a two-parameter Weibull distribution. If the data and the fit are straight, we have some assurance that the Weibull distribution described the data.
And, yes if the data is curved or bent, then it is either the wrong distribution and/or there are multiple failure mechanisms at play that would be better described independently. Or, sometimes, if one the data points is at time zero, some fitting package have the lower tail flatten out horizontally and is an artifact of log scales and the fitting routines See the red a line on the plot below. Another common one for Weibull data is the lower tail starts nearly vertical then follows some slope, beta. This is an indicator that a three parameter Weibull may describe the data better to account for a possible initial failure-free period. I only use this if there is a physical reason to expect a failure-free period, like the span needed for shipping is always at least 30 days. If there aren’t reasons for the delay or failure-free period, I would only use the three parameter Weibull if there is a lot of data, like 100’s of data points. See the green line, b, for an example shape for this behavior. (CDF indicators4.jpeg)
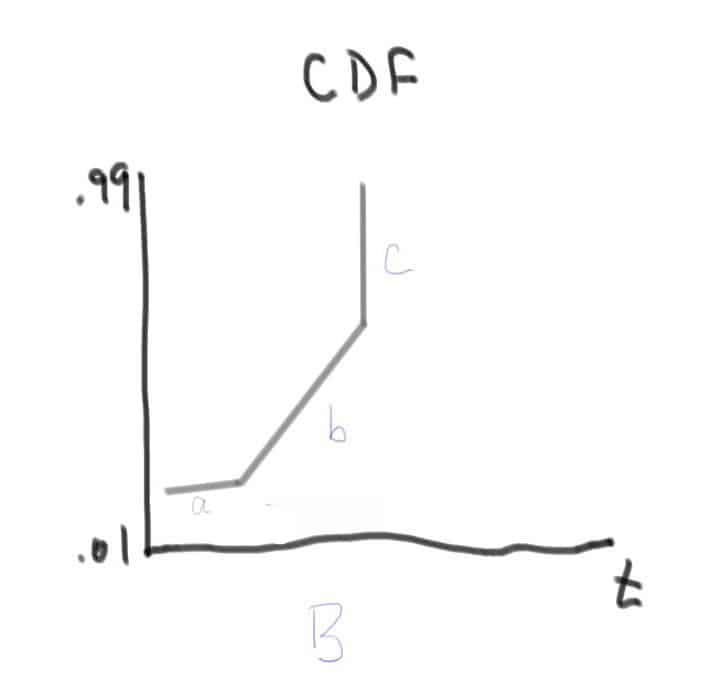
Next, let’s consider when there are mixed failure mechanisms at play. (CDF indicators2.jpeg)
 Here in Plot B, line segment a is a shallow slope, probably less than 1 and would indicate a failure mechanism associated with an early life failure mechanism (factory escapes, vendor batch issues, installation damage, as common examples). Line segment b is another steeper slope, and if one did a little failure analysis would probably find some different set of failure mechanisms at play here than in line segment a. And finally line segment c is very steep, and again one would find yet another failure mechanism. All failure mechanisms are ready to cause failure; here there are three that dominate the time to failure of the product. And, if there is enough data for each failure mode, separating them into three lines would be more useful to represent what is going on.
It is more common with sparse data to see the system as a relatively smooth (straight line) as there isn’t enough data to suggest otherwise, yet breaking down the data by failure mode or mechanisms may reveal the source of a pattern as in plot B.
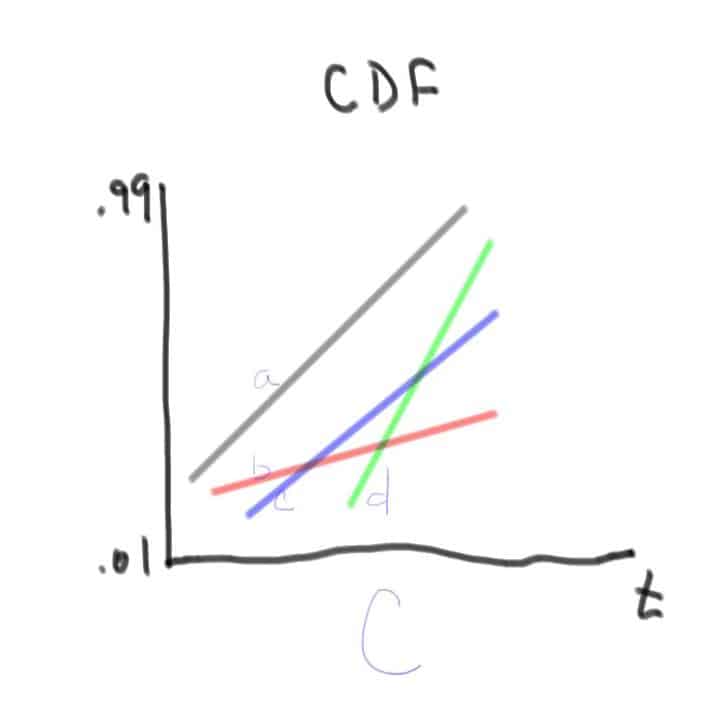
 See in plot C, (CDF indicators3.jpeg) to see a system line, line a in gray, plus three other lines, b in red, c in blue, and d in green that each represent a separate failure mechanism. Collectively the three lines create the system line, a. And, the three lines, b, c, and d, provide information about each failure mechanism that may be more useful for modeling, troubleshooting, maintenance planning, and more. And, if we run these products longer the green line d will eventually cross the system line a, forcing it to look line plot B’s line segments b and c.
As this discussion illustrates there certainly can be non-linearlites in a CDF and they commonly indicate either the need to investigate other fits, fitting approach, data errors or anomalies or underlying mixed sources of failures. Understanding how to read a CDF including the fitted line and data points can provide a wealth of information and insight.
Let me know if you have any questions, and thanks for asking this one.
Cheers,
Fred
Related:
Censored Data and CDF Plotting Points (article)
The Four Functions (article)
Lognormal Distribution (article)

Dear Fred,
such nice way of explanation. I thank you
i have a question: i recently started working on Reliability topics working for automotive industry for the product called ECU engine management Electronic Control Unit; (with aluminum housing)
since my job restricts within Design validation (B or C sample stage) very little data would be in hand, i am asked to predict reliability either before the tests or after the failure; chamber test failures, shaker test failures, solder joint failures, and functional failures. in such scenario i would like to ask your suggestion;
to built my reliability concepts strong where should i start from ?
wanted to face customer with immense confidence with strong reliability ,,, could you please share your approach.
thank you
Madhu
Hi Maddirala, noticed you asked a similar question under the post ‘Success Testing Formula Derivation’, so please see my response there. cheers, Fred
https://creprep.wordpress.com/2015/11/30/success-testing-formula-derivation/#comment-1744