
There are rare situations when we would like to estimate the reliability at the lower confidence level after estimating the mean from a sample (often a test result). And, to make even more rare of a situation, we know the population standard deviation.
This is not the same as tolerance intervals which we’ll cover in a separate post. Confidence intervals deal with the sampling and the estimate of a specific population parameter. Tolerance intervals apply to the individual values not the parameter, the mean for example.
I heard from Professor Bill Meeker that they did a study of incandescent light bulbs and found they wear out with a normal distribution. For the purpose of this example let use the variance of the wear out time to be 625 hours2. And, let’s say we tracked 25 light bulbs in our home and found the average time to failure to be 2,000 hours.
We are interested in estimating the time till at least 95% of the bulbs are working with 90% confidence. What is the 95% level of reliability with 90% confidence?
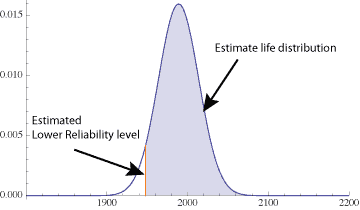
One way to step through this type of problem is to consider 7 steps that essentially permit us to estimate the mean value, determine the lower confidence level for that estimated mean value, then calculate the point in time where the first 5% have failed (95% still working).
1. Determine the required reliability and confidence levels for the estimate.
This is often provide by management or local policy. For example, in this example problem we are asked to find the 95% level of reliability with 90% confidence.
2. Determine the value of the standard deviation.
We are given the population variance or standard deviation for this type of problem. In this case population variance is 625 thus the population standard deviation is 25. While it is rare that we know the population variance it is possible given previous studies.
3. Obtain the samples size, n.
This is from the sample used to create the estimate of the time to failure average or mean. We have data from an experiment using 25 light bulbs, thus n = 25.
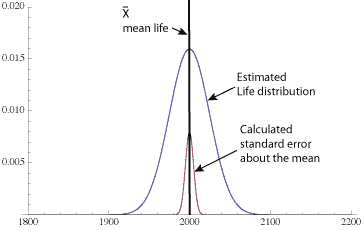
4. Estimate the value for the mean life, X̄
Sum the time to failure data and divide by n. Or, as given in this example, X̄ = 2,000
5. Estimate the standard error of the mean as σ / √n
The standard deviation is 25 and the square root of the sample size in this case in 5. Thus the standard error is 25 / 5 = 5. This value along with the Z value corresponding to the confidence level permits the next step.
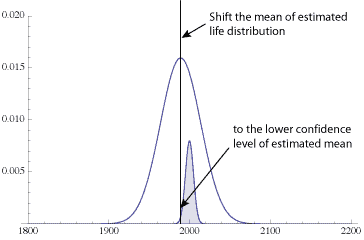
6. Calculate the lower confidence for the mean life at the given confidence level
$$ \large\displaystyle {{\bar{X}}_{L}}=\bar{X}-Z\frac{\sigma }{\sqrt{n}}$$
where Z is the z-value from your favorite standard normal table corresponding to the confidence level desired for the estimate of the mean life. We have the standard error of the mean of 5 from above, and the z-value for the one-sided lower confidence of 90% is 1.282. Inserting the numbers and calculating we find
$$ \large\displaystyle {{\bar{X}}_{L}}=2,000-1.282\times 5=1,994$$
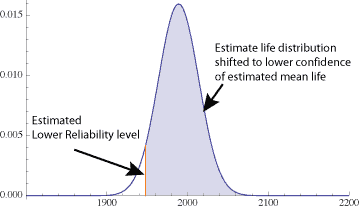
7. Calculate the lower limit for reliability as it is found Z standard deviations below the lower confidence limit for the mean life.
$$ \large\displaystyle {{X}_{(1-\alpha )}}={{\bar{X}}_{L}}-Z\sigma $$
We know al the values thus can calculate the answer to the sample problem. Here we’re interested in the lower tail containing 5% thus Z = 1.645.
$$ \large\displaystyle{{X}_{(1-.05)}}=1,994-1.645(25)=1,953$$
Related:
Tolerance Intervals for Normal Distribution Based Set of Data (article)
Confidence Interval for Variance (article)
Statistical Confidence (article)
What does 95% level of reliability with 90% confidence mean? Look for many definitions but still very confused what it actually mean, any example with numerical explanation ?
Hi Zita,
95% reliability means that 95 out of 100 units survive for the associated duration of time operating and providing the function required/expected, and in the users environment and use conditions.
90% confidence means that the sample we used to estimate the reliability has a high chance of being below the true value. Stated another way, there is a 10% chance that the estimate overstates the reliability value and the true value is actually lower.
After doing the calculations we find that 4.8 years is the 95% reliability lower 90% confidence level. That means we expect that 95% of the units will survive at least 4.8 years without failure based on the sample, and the risk of this being in error due to the sample not truly representing the population as 1 in 10, or 90% probably right.
This would be useful for setting up and analyzing a product life test. Given a sample of units that are tested and represent the time to failure distribution for a product, we calculate the lower reliability threshold at a confidence level. If our goal is 99% reliable at 2 years, then we would say the test meets this goal if the results showed at least 99% reliability at 2 years or higher, with an agreed upon confidence level (often something like 90% or higher is desirable).
Hope that helps.
cheers,
Fred
Thanks very much. I plan to use you approach to explaining this in my discussions from clients, giving you credit of course. Including your comment. No easy answers to helping managers and engineers understand each other on these rel stat issues. So I collect many views and graphs, from Meeker and others.
Hi Fred,
Thanks for sharing the knowledge. I would like to get more information on this. As i could see in Relaibility tools we have options like Lower, uppper and two sided. is there a way to choose them.
Hi Srinivasa,
Good question about how to decide and one that deserves a post to itself. In short though the selection of the confidence interval is related to the question being asked of the sample data. We know the sample has some uncertainty concerning the location of the population parameter being estimated. The CI provides a range where the sample data says the parameter lies with stated confidence.
If you want to know:
is the reliability average value at least 0.9 or higher, then we would calculate the lower one sides confidence level about the sample mean life.
is the reliability average value less then 0.95 (for example is we are judging a vendors claim) then we would use the upper one sided confidence level.
is the reliability average value within 5% of 90% (for example, we are interested in being on the target and not too high or too low – for some reason – this makes more sense when considering physical dimension of say a mechanical part), then we would use the two sides confidence level about the mean.
hope that helps.
cheers,
Fred
Regarding item 6, the Z value to insert on XLbar formula was not suppose to be 1.282 for 90% confidence level? Because 2.282 is for 98.9% confidence level. Am I right on my calculation? In affirmative case, the remaining calculation might be fixed.
Hi Alex,
Good catch – thanks for the careful read. I’ve updated the formulas and checked the calculations. I think it’s good now.
cheers,
Fred
Fred,
Good to know that my CRE preparation is worthing for next year.
Just a minor adjustment about the final value which I get 1,953 as final result.
Regards
Alex
Hi Alex,
Yeap, my notes show 1953 and I wrote 1958 – corrected now and thanks for letting me know.
cheers,
Fred
Hi,
How did you calculate 4.8 years? “After doing the calculations we find that 4.8 years is the 95% reliability lower 90% confidence level”
Hi Sama, I’ve reread the post a couple of times and not seeing any reference to 4.8 years. Maybe I am missing it, yet help me understand your question, please. The steps for the calculation are step by step in the article, is there a particular step that is not clear? cheers, Fred
I believe this is in reference to an answer you gave to another question. It appears to be just a number plucked from the air to make the sentence easier to understand.
Nothing to worry about.
Hi from Czech Rep.,
It is a nice explanation with practical use. Thanks a lot.
Anyway, I have one additional question how I get a mathematical inferred describing for final reability factor called “k” for bruceton test (up and down test). In other words, “k” describes final reability to be for instance 99,99% on the confidence level 95%?
Note: mean – ks, where “s” stands for standard deviation for sample with size n=50
Thank you in advance.
BR,
Jan
Where did you get the 1.282 from
Hi Jay,
from a standard normal table. See https://lucas-accendo-site-speed.sprod01.rmkr.net/reading-a-standard-normal-table/ for how to find the reading.
Cheers,
Fred
Hello,
nice example..thank you.
My question:
The problem is that we usually dont know a standard deviation (in your example, 625h2) in practical situatuon… How is a mathematical approach for this case to have reliability with confidence?
Thnak you.
Jan.
Hi Jan,
If you have data to estimate a mean, you likewise can estimate the standard deviation. Even with small sample sizes this is better than guessing or not understanding the bounds, if needed.
One technique that may help with limited samples is a bootstrap method to extract a meaningful standard deviation value. This is something I should probably write about.
Cheers,
Fred
Sorry to only find this years after you posted it, and even sorrier to have a query.
When calculating the value representing the lower confidence level on the sample, why did you use the Z-score (1.282 for 80% 2-sided confidence) as the multiplier in step 6?
As it is a sample distribution (n=25) my instinct is to use the t-test for a sample of 5, which would be 1.318 to leave 10% in the tail.
The outcome is one year less – 1952.
Thoughts?
Cheers,
Brenda
Good point on the t-test, and as you calculated with n = 25 it makes just a slight difference. Also, here we know the population variance, hence more comfortable using the normal distribution. cheers, Fred
Honestly one of the best and most direct explanations of Reliability/Confidence. I’ve struggled for a long time on how to connect both Reliability and Confidence. I could get the answers I needed to pass acceptance criteria by plugging in the numbers to Minitab and doing a common sense check on the results, but I never exactly understood how my confidence/reliability values were working together to move my final reliability percentile.
Thank you so much, I can sleep a little easier now :).
Hello! Thanks for a great article, this was very helpful and one of the only resources I can find online on this topic.
I was wondering how you would extend this concept if you were using a lognormal distribution instead of a normal distribution to represent your data set? Appreciate any advice you might have.
Hi Brad,
Hum, I’ll have to check my reference, yet, my first answer would be that it’s basically the same process as outlined in this article except using the log normal or whichever distribution applies in your case. The estimate of standard errors may invoke the central limit theorem, which is the part I would want to double check.
May make a good article that is similar to this one, yet with a different distribution.
cheers,
Fred
Thanks Fred, that makes sense. I was having trouble finding good Z-values for the lognormal distribution, that Z-table doesn’t seem as popular and well published. Am I right to think the Z-values from the normal Z-table do not apply?
Hi Brad,
using the normal distribution for the z-value – might work when dealing the confidence about the mean, in large part due to the central limit theorem, yet that is something I would want to check to be sure. Keep in mind that the log normal like most distributions is not well suited for converting to a standard normal type distribution that permits a single table to be created. Instead you would likely have to calculate the z-value like values based on the specific distribution in question.
cheers,
Fred
Thanks Fred, appreciate the response!
Hello
Please, I have a question regarding the duration of the test and retest. We will consider how much to be standard. For instance, one day, one week, one month.???
Thanks
Hi Begard,
That will depend totally on how you source the time to failure data. It may be from a sample of field data, an accelerated life test, an ongoing reliability test, or demonstration test, or something similar. Once you have the data, then this set of calculations becomes useful.
cheers,
Fred
Hi Sir,
I want to ask how accurate is a 90% confidence interval versus a 99.99% confidence interval to prove a claim?
Best regards,
Joel
Remember that the confidence interval is not a measure of accuracy, rather a measure of the sample results uncertainty related to representing the population value. 99 or 99.99 are just different representations of where the sample would suggest the true value may lie if the sample was representative of the population.
To improve the ability of a sample to truly represent the population, take more samples, and reduce any measurement error, as well.
cheers,
Fred
Hi Fred,
I have a question on reliability and confidence though not directly related to the above example.
If we had a reliability and confidence requirement for a system ( say 90% reliability with 90% confidence) more expensive than a light bulb, and we can demonstrate this requirement only through sub-system testing:
1) Reliability can be estimated using block diagram modelling depending on series, parallel, k out of n etc.
2) How does confidence level translate from a sub-system to system level? Assuming you have two sub-system in series which have demonstrated 90% reliability each with a confidence level of 90%, what confidence can I have on the system reliability.
Hi Ravi,
good question – the simple answer is the confidence intervals are additive – the heart of the CI is an estimate of the variance and when combining variance, they add (not the standard deviations, the variances). Now, in a model and assuming the variance in each element of the model is independent, they add…. Another technique many use and it works for more complex models is to use a Monty Carlo approach to combine the different distributions within each block.
Generally, the CI at the system level even for a simple model gets pretty big, quickly – as we’re combining all the various uncertainties ( estimated variances ) for the different elements.
cheers,
Fred
There is one question that came up from our project: what is the difference between two populations having different results of life tests (could be accelerated life tests).
If this is measurement (for example length), then we could compare the means and calculate the Z value,which is the typical null hypothesis. However, this should be different from results of life tests.
There seems like multiple ways for comparing the life test:
1) comparing the fits of the life tests with giving confidence interval and see if there is overlapping.
2) if the two life tests could both fit to Weibull, then we have the weibull parameters and we could calculate the confidence interval of these parameters. Based on the parameters, we could plot the contour plots (of these parameters) to check for any overlapping.
I am checking if you have any suggestion.
Hi Lihong,
Thanks for the question – and while you laid out a couple of ways to compare the two populations or life distributions – you need to start with what you are trying to learn or understand. If this is one option/vendor/solution being more or less reliable than the other – a hypothesis test approach or plotting both distributions’ reliability functions may be most informative. Or, if the comparison is over a specific duration, then another approach may be more useful, for example using the expected number of failures over the duration.
I have found using the confidence of the distribution parameters to be problematic as they are typically very large unless you have very large sample sizes and/or very, very low variances. I tend to use the estimated distribution to calculate a statistic of interest for comparison, and avoid using the parameters directly. You may want to explore using the statistical approach called bootstrapping to get the confidence intervals and there are other methods to help get accurate intervals.
I’ll copy Chris Jackson as he may also have useful insights and recommendations.
cheers,
Fred
Fred, great suggestion!
Could you elaborate the bootstrapping method a bit more for reliability testing and analysis of life testing?
Hi Herman,
Bootstrapping is a statistical method using sample data to derive accurate variance-based statistics, such as confidence bounds. There are many online descriptions and how-to’s out there. The method does have a steep learning curve, yet is a very powerful method very useful when comparing two datasets, among other uses.
cheers,
Fred
Hello Fred,
Thanks for the detailed explanation for confidence and reliability and sorry for the doubt after many years of your post. Still have a doubt in concluding it..
With respect to your example:
1. Is it like 90% confidence means the sample we used to estimate has 10% chances of having less life than reliability value of 1953hrs?
2. Or Is it like the sample we used to estimate has 90% chances of having less life than reliability value of 1953hrs?
Please reply..
Hi Nilesh,
Good question.
Keep in mind that the sample is just a subset of a population and that means our estimate of the population parameter is uncertain due to using a sample.
A larger sample reduces this uncertainty and for the same confidence a larger sample will result in a smaller confidence bound. This means the confidence does not change the actual population value, which we’re trying to estimate, it only reflects the amount of uncertainty due to use a sample.
I think you first question is more correct, there is a chance that the sample will over estimate the true parameter 10% of the time we take a sample do the analysis. The way I interpret confidence and it may not be technically correct, is that a sample is our estimate of some population value – the confidence interval is where we expect the true value to actually exist, in this case 90% of the time…. or the true value may fall outside the confidence interval 10% of the time. WE don’t know which it is – and it becomes a tradeoff decision between using larger sample sizes along with higher confidence values to be more sure the results reflect the true value – and cost or time to get the answer.
If we could measure the entire population we would not need confidence bounds.
cheers,
Fred
Thank you very much Fred for the detailed clarification. I guess I am good now. Really appreciate your quick response.
You’re welcome and thanks for visiting and learning via Accendo Reliability. cheers, Fred