
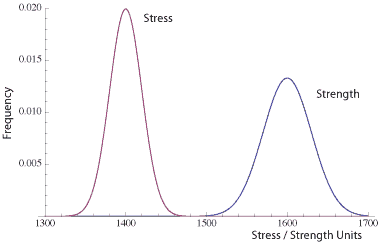
 Ideally, in every design of every component, the stress – strength relationship looks like this figure. The stress is well below the strength.
This implies there is very little chance of failure due to the element being overstressed. Also, ideally, we fully characterize all stresses and all strengths for each element of a product. This is generally difficult to accomplish, and it is rarely done to that extent.
 In practice, we narrow down the list of critical parts and then perform the stress – strength calculations.
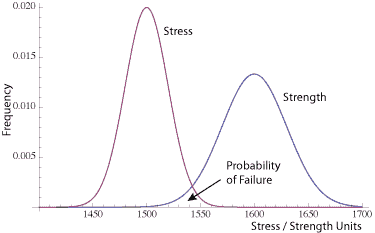
There are occasions where there is a definite possibility that some of the elements will experience the chance of stresses that are higher than that element’s ability to survive. It is this intersection between the two curves that provides the probability of failure. To calculate that area is to define the double integral that solves for the probability of the stress being higher than the strength. Think of a small normal curve under the overlapping curves.
NOTE: I did not shade in the area under both curves which would overstate the probability of failure. As noted by careful readers, in the case when both stress and strength are normally distributed (be sure to verify that is true) the probability of failure is itself a normal curve. I was not able to draw a good enough looking small normal curve and will try to sort it out, so it’s clear.
Notation
When we fully characterize the stress and strength we often can use a probability distribution to describe the location and variation of the values.
- Probability of failure, pf = P( Y < X )
- Strength, Y is a random variable with mean μy and standard deviation σy
- Stress, X is a random variable with mean μx and standard deviation σx
- Safety factor = μy / μx
- Safety margin = μy – μx
The random variables can be described by any distribution.
Three Cases
Given we may have incomplete information or only estimates for either the stress or strength, one of three cases may apply for the stress – strength calculation. The first two permit the calculation of the probability of failure directly using the probability density function, PDF. The last case may require using some calculus.
- Fixed and known strength, but random variable for stress, X.
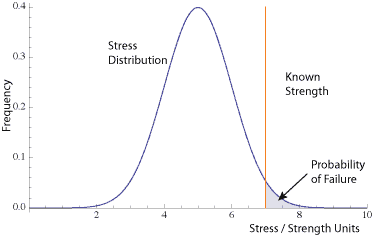
$$ \large\displaystyle {{p}_{f}}=\int_{y}^{\infty }{{{f}_{x}}(x)dx}$$
Failure occurs if stress exceeds known strength. It is the area under the stress distribution to the right of the known strength value.
- Fixed and known stress, but random variable for strength, Y.

$$ \large\displaystyle {{p}_{f}}=\int_{0}^{x}{{{f}_{y}}(y)dy}$$
Failure occurs if the strength falls below the known stress. It is the area under the strength distribution to the left of the known stress.
- Both stress and strength are random variables.
Failure occurs when the stress is greater than the strength. It is the probability represented by the area under the two curves. It is a distribution of it’s own, which we’ll approximate in the next section.
$$ \large\displaystyle R=P\left[ \text{Stress}\le \text{Strength} \right]=\int_{0}^{\infty }{{{f}_{stress}}\left( x \right)}{{R}_{stress}}\left( x \right)dx$$
Two Normal Distributions
A special case and it may apply in your situation, is when both the stress and strength reasonably fit a normal distribution. When this occurs we do not have to solve the double integral. It is the difference between the two distribution that is of interest, D = Y – X. This difference has the properties of a normal distribution with
$$ \large\displaystyle {{\mu }_{D}}={{\mu }_{y}}-{{\mu }_{x}}$$
This difference in means is also called the safety margin.
$$ \large\displaystyle \sigma _{D}^{2}=\sigma _{y}^{2}+\sigma _{x}^{2}$$
Which permits the direct calculation of the probability of failure
$$ \large\displaystyle {{p}_{f}}=\Phi \left( -\frac{{{\mu }_{y}}-{{\mu }_{x}}}{\sqrt{\sigma _{y}^{2}+\sigma _{x}^{2}}} \right)$$
$- \Phi -$ is referring to the standard normal distribution. The term inside the paratheses is a Z-value. We are looking for the area under the standard normal curve to the right of the Z value. In this calculation, the area, or probability, is the chance of having a high enough stress applied to a weak enough strength item leading to a failure.
Example
Given the stress distribution with a mean, μx, of 1500 and standard deviation, σx, of 20, and given a strength distribution with a mean, μy, of 1600 and standard deviation, σy, of 30, determine the probability of failure?
$$ \large\displaystyle {{p}_{f}}=\Phi \left( -\frac{1600-1500}{\sqrt{30_{{}}^{2}+20_{{}}^{2}}} \right)=\Phi \left( \frac{100}{\sqrt{1300}} \right)=\Phi \left( 2.77 \right)=0.0028$$
Related:
Weakest Link (article)
Reliability Management Terminology (article)
Discovery Testing (article)
Fred,
Thanks for posting this information. However, a clarification may be needed in your third case. I see this in the literature quite often and maybe it is just my flawed interpretation but the graph shown seems to indicate that the area of overlap of the stress and strength distributions is numerically equal to the probability of failure. While this overlap does represent, as you mention, the probability of failure, it is not numerically equal to the probability of failure. For example, if the stress distribution and the strength distribution were identical, the overlap area would be 1 but the probability of failure equation gives 0.5.
Mark
Hi Mark,
Thanks for the note – I agree and the area that represents the probability of failure is a small normal curve under the overlapping tails. I was having trouble drawing a good enough small normal curve – so, didn’t shade that overlap. I probably should sort out a good enough image and update.
The way I think of it, is we have to run into the occurrence that the stress is larger than the strength. Just because the stress is high, doesn’t imply the strength is low – it rarely occurs in this case with little overlap. Likewise, if the part is not very strong, it may only experience relatively weak stress and again not fail.
The double integral and the special case for two normal distributions does the math right, as you noted.
Now to sort out how to add a proper small normal curve to my graphic.
cheers,
Fred
PS: Glad to know someone is reading these posts closely.
Hi Fred,
I read the last statement from Mark and trying to understand how the probability of failure equation is calculated as 0.5. Can you share some reference?
Statement from Mark – “For example, if the stress distribution and the strength distribution were identical, the overlap area would be 1 but the probability of failure equation gives 0.5.”
Hi Arunkumar,
The formula for two normal distributions is in the article – just set both strength and stress to the same distribution and work it out. We only have a failure when the stress is greater than the strength – and if half the time stress is less and half it’s larger, remember we’re taking random sample from each distribution, then we would be 50% failures.
cheers,
Fred
Thanks Fred for your explanation. It helps.
However, i was trying to arrive that mathematically, and not just for normal distribution but for other distributions also. i could do a simple calculation for normal distribution based on the formula that is shared and verified it to be 50% ,but i was trying to calculate this for other distributions especially the weibull.
Once again thanks for your explanation.
Regards,
Arun
Hi Arun,
The formula is the R = P(stress less than or equal to strength) formula
This is more details on reliawiki, http://reliawiki.org/index.php/Stress-Strength_Analysis and we should probably work out a couple of examples here and post here on Accendo Reliability
thanks for asking.
cheers,
Fred
Hi Fred,
Thank you for this great article on Stress-strenght analysis.
I have a question that I hope you may be able to answer. In the third case, where both the stress and strength are random variables, you assume no correlation between the two, X and Y. How would one calculate the variance of the random variable D, if correlation were permitted?
I would also like to see your calculations leeding to the formula
sigma^2_D = sigma^2_y + sigma^2_x .
Jacob
Hi Jacob,
Thanks for the comment. First, variances are additive whereas standard deviations are not. A good graduate stats book would probably have the derivation and background.
For the case when there is a dependance between the stress and strength – I do not know. Maybe someone on the Linkedin forum of CRE Preparation or ASQ Statistics would be able to help. The only methods I’ve seen assume either complete or no correlation. Which seems to be at the extremes for what your are asking. I’ve run into a similar issue and am also wrestling the solution. If I find something I’ll be sure to post about it.
cheers,
Fred
Hey Fred,
I noticed one item that should also be reviewed. This procedure looks sound when dealing with individual occasions of stress/strength conditions.
Does this application also involve cyclic loading, where the material strength would decay over a said number of frequency or time. You would be dealing with a changing graph or have to add an additional dimension to relate number of cycles performed with frequency/possibility of future failure.
Hi Jacob, yes, this is a very simple and rather unusual case when the stress and strength are both normally distributed and only one stress. In reality, our products and systems experience many stresses – and you are right in assuming the stress-strenth analysis would become more complicated.
This is just a static situation in this article. Not only does the strength deteriorate with on average it may also increase in standard deviation as well, The same, in some situations, applies to the applied stress as well. Again the methods to calculate the stress strength relationship becomes more complex.
Cheers,
Fred
I thank you for the clarification of two (joint) random variable concept, I had trouble with this shaded area for long time, right now got cleared up.
Thanks,
Hossein
What is the value of that “Phi” variable? I don’t understand where that came from? Thanks
You are right, I did not explain phi – and have added an explanation. In short, phi refers to the standard normal distribution. Given the calculation represents the amount of interaction or Z value, we can use the standard normal to determine the probability of occurrence. If and only if both the stress and strength distributions are normally distributed.
Hi Fred,
Can you direct me to a solution for finding the probability of failure for non-normal distributions?
HI Thomas, try this link at reliawiki
http://reliawiki.org/index.php/Stress-Strength_Analysis
cheers,
Fred
Hi Fred,
Regarding your comment..
“the area that represents the probability of failure is a small normal curve under the overlapping tails”
How do you actually go about showing a graph like this? I’m struggling to make it work in excel (i.e developing equations for the small normal curve inside the overlapping tails
Hi Tom,
the small normal has a mean of the difference of the means and the variance is the addition of the two variances. Those are the parameters for the distribution of the overlapping area when the stress is larger than the strength.
cheers,
Fred
Hi Fred,
Thanks for the article!
I have used this analysis where the X axis is a lifetime parameter like #hours, #cycles, or #Miles.
But I have never seen this analysis where the the X axis was a physical stress like Drop Height or Temperature or Voltage.
So I was wondering if it works for such physicall stresses too.
For example, say,
I have a Stress plot (from customer survey) – a distrubution of drop heights;
And, I also have a Strength plot from test data – distribution of failures with respect to drop heights.
If I now apply Stress-Strength analysis to the above curves, is the resulting number an estimatation of the failure rate in field from drops?
Hi Rajiv,
it could be – be sure the two curves are normal distributions in order to use the analysis in the article, else use the appropriate distributions and integration to solve the stress-strength equation.
cheers,
Fred