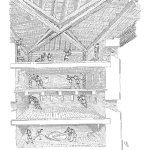
A complex production process requires a mixture of leadership, governance and management. In this article, we’ll discuss a tiered meetings structure that can effectively enable this. Empowerment, escalation paths, accountability and responsibility are included as some key ingredients. We’ll start with the following diagram:
II. A. 7. Statistical Process control (SPC) and process capability
Chance of Catching a Shift in a Control Chart
Control charts help us monitor and stabilize a process. A little graphics along with statistics provides a tool to identify when something has changed. Some changes are abrupt and obvious, other a little more subtle, yet the out of control signals each have approximately the same chance of alerting us to a change.
A little graphics along with statistics provides a tool to identify when something has changed. Some changes are abrupt and obvious, other a little more subtle, yet the out of control signals each have approximately the same chance of alerting us to a change. [Read more…]
Nelson Funnel Experiment
Dr. Nelson created a simple experiment to illustrate the effect of meddling with a stable process. (Dr. Deming did something similar)
While the intent of making small changes to a process may be to make improvements, these perturbations generally increase the variation of the results.
To improve a process requires understanding the source of the variation and often controlled experiments to identify process improvements. [Read more…]
Individuals and Moving Range Charts
Another variation of the X-bar and R chart, in this case measuring and plotting individual readings instead of a sample average. The range value is obtained from the current reading and a fixed number of previous readings.
This type of control chart is suitable for calibration or testing situations where it is not practical to create subgroups of items for samples. [Read more…]
X-bar and Sigma Charts
The s chart replaces the R chart and provides an increase in sensitivity to variation of the spread of the data.
The s-chart works better with 10 or more items per sample in order to obtain the s (standard deviation) estimate. The use of a spreadsheet or calculator expedites the calculation of the sample standard deviation.
Introduction to Control Charts
Control charts provide an ongoing statistical test to determine if the recent set of readings represents convincing evidence that a process has changed or not from an established stable average.
The test also checks the sample to sample variation to determine if the variation is within the established stable range. A stable process is predictable and a control chart provides the evidence that a process is stable or not.
Some control charts use a sample of items for each measurement. The sample average values tend to be normally distributed allowing straightforward construction and interpretation of the control charts. The center line of a chart is the process average. The control limits are generally set at plus or minus three standard deviations (of the sample means – commonly called the sampling error of the mean) from the grand average.
Variable Selection for Control Charting
Every process should operate stably. Every process may have many measurements available to monitor either various aspects to the final product or the assembly equipment. There may be hundreds of possible items to measure and monitor.
We do not have the resources nor time to apply control chart principles to each possible measurement. Control charts do not directly add value and they have a cost to maintain and interpret. While it may be tempting to add a dozen or so control charts, as the cost increases the value quickly decreases.
Special and Common Causes of Process Variation
As stated before, variation happens.
The root cause of the variation for a stable process includes material, environmental, equipment, and so on, changes that occur during the process. No saw cuts the same length of material twice – look close enough there is some difference. [Read more…]
Pre-Control Charts
An easy method to monitor and control a process average. It is an alternative to the Shewhart control chart.
Pre-control charts work well with stable and slow process drifts or changes. These charts provide a means to monitor a process and act as a guide for process centering.
They are easier to setup, implement, and interpret the Shewhart charts. [Read more…]
Process Capability
The connection between the specifications or drawings or design requirements and the manufacturing process is the capability of the process to consistently create items within spec.
A ratio of the specification over the spread of measured items provides a means to describe the process capability.
The ratios rely on the standard deviation or spread of the produced items. The index is meaningful only if the process is stable. Thus beyond making sure the measurements have minimal measurement error, check the stability using the appropriate control chart.
In this article we are assuming the measurements are normally distributed, yet knowing that is not always the case, you can calculate capability indices using the actual distribution.
The indices will have similar interpretations yet take care when applying these concepts using other than normal distribution data.
Sources of Variation
We have statistics to describe the variation that occurs in our world. Statistics is the language of variation.
If each of your produced products were identical in every way to all products produced, with no variability, we wouldn’t be concerned with the effect of variation on the performance and reliability of our designs.
Yet, variation does happen and we have a range of tools to identify and minimize the naturally occurring variation. [Read more…]
When Are We Out of Control
For a stable process, nothing much happens. If the stable process is producing acceptable products, we should expect to continue to produce acceptable products.
Unless something changes. [Read more…]
8 Steps to Creating an X-bar and s Control Chart
Once you decide to monitor a process and after you determine using an $- \bar{X} -$ & s chart is appropriate, you have to construct the charts.
The $- \bar{X} -$ & R charts use the range as an approximation of the variation in the population. When feasible use the standard deviation, s, rather than the range, R for the improved efficiency in detecting meaningful changes in process variation. [Read more…]
8 steps to Creating an X-bar and R Control Chart
Once you decide to monitor a process and after you determine using an $- \bar{X} -$ & R chart is appropriate, you have to construct the charts.
This is not difficult and by following the 8 steps below you will have a robust way to monitor the stability of your process. [Read more…]
Variables Control Chart Background
What are Variables Control Charts?
From NIST Engineering Statistics Handbook, section 6.3.2, with edits and additions.
During the 1920’s, Dr. Walter A. Shewhart proposed a general model for control charts as follows: [Read more…]