Most reliability engineers are familiar with the life cycle bathtub curve, the shape of the hazard rate or risks of failure of a electronic product over time. A typical electronic’s life cycle bathtub curve is shown in figure 1.
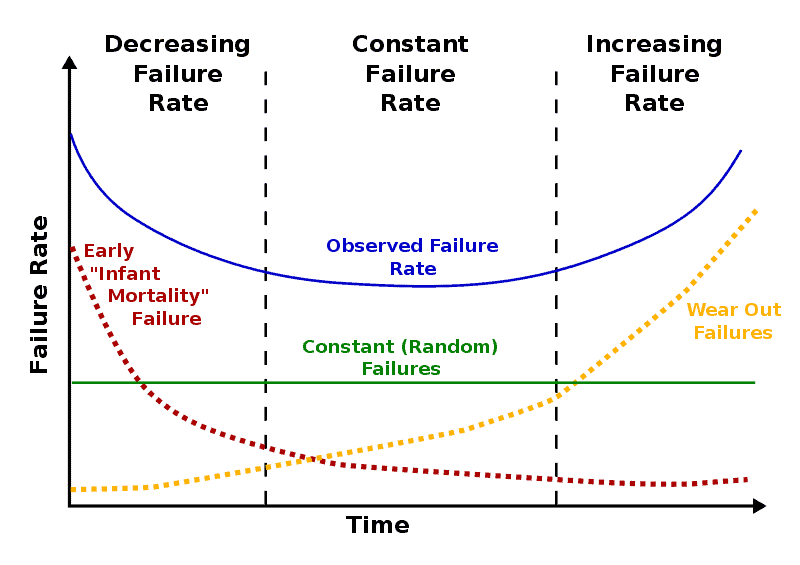
The origination of the curve is not clear, but it appears that it was based on the human life cycle rates of death. In human life cycles we have a high rate of death due to the risks of birth and fragility of life during that time. As we age, the rates of death decline to a steady state level until we age and our bodies start to wear out. Just as medical science has done much to extend our lives in the last century, electronic components and assemblies have also had a significant increase in expected life since the beginning of electronics when vacuum tube technologies were used. Vacuum tubes had inherent wear out failure modes that were a significant limiting factor in the life of an electronics system.
During the days of vacuum tubes, wear out of the tubes and other components were the dominant cause of field failure. Although errors in the design or manufacturing probably contributed to field failure rates, the mechanical fragility and limited life of vacuum tubes dominated the causes of system failures in a few years of use.
Traditional electronics reliability engineering and failure prediction methodology (FPM) has in its foundation the concept of the life cycle bathtub curve. The declining hazard rate region is called the “infant mortality” region. The wear out failure modes of electronics results in the increasing hazard rate represented at the “back end” of the bathtub curve. The concept of the curve has been used as a guide for “burn-in” testing and, of course, for establishing the misleading and meaningless term, MTBF.
In order to make a life prediction for an electronics assembly some assumptions must be made regarding the quality and consistency of the manufacturing process as well as assumptions on the distribution of life cycle stresses. To create models for electronics devices we must assume that the manufacturing process is capable and parts being produced are from the center of the normal distribution. We also must make assumptions about the frequency and distribution of the life cycle stresses. It is difficult to account for variations at all the manufacturing levels in models without creating significant complexity. The same applies to accounting for variation in life cycles stresses the product population will be subjected to.
Today’s electronics components, especially semiconductors, have an inherent “life entitlement” is relatively infinite relative to the technologically useful life of the system it is in. We will not likely empirically determine the life for the vast majority of electronics components and systems because technological obsolescence occurs relatively quickly. The pace of significantly better performance and features with electronics systems is not likely to slow down, and therefore the rate of technological obsolescence will not slow down. Of course there are some exceptions in electronics, such as in energy systems. Wind and solar energy systems costs justifications are based on 25 years of use.
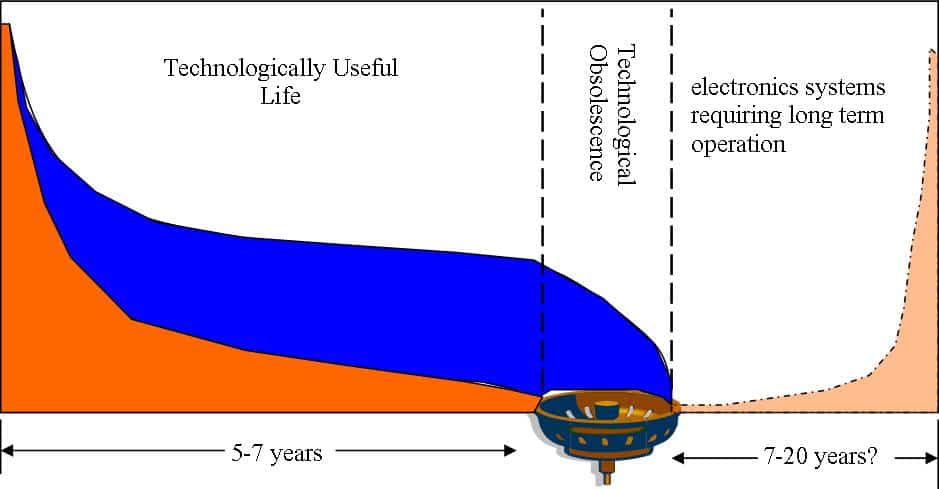
Using the same life-cycle “bathtub” curve analogy, technological obsolescence is the “drain” that is before the back end of the life cycle (wear out) mode occurs. Figure 2 is a graphical representation of the bathtub curve with the “drain”. The drain is the point in time that electronics is replaced due to technological obsolescence. Because of this technology obsolescence drain the back end of the bathtub curve a relatively small contributor to the overall costs of failure for customers and manufacturers in a very large percentage of electronics. Obsolescence is especially rapid in consumer and IT hardware. The infant mortality at the front end is where most manufacturers and customers realize the costs of poor reliability development programs and what determines future purchases for most consumers.
The causes of failures during the early production are mostly due to poor or overlooked design margins, errors in manufacturing of the components or system, or abuse (sometimes accidental). Precise data on rates and costs of product failures is not easily found, as reliability data is very confidential, but most who deal with new product introductions realize that most costs of unreliability come from the front end of the bathtub curve and not much from the wear out end of the curve. Poor reliability may result in total loss of market share in a competitive market. The backend of the bathtub curve is for the most part irrelevant in the case of high rates of failure, as an electronics company may not be in business long enough for technological obsolescence to be a factor, and even much less “wear out” failures
The electronics industry in the last few decades has been misdirected in the belief that life in an electronics system can be calculated and predicted from components rates of failures and models of some failure mechanisms (i.e. MIL HNBK 217) although there has been no empirical evidence of any correlation of most predictions to field failure rates.
The vast majority of costs of failures for almost all electronics manufacturers come in the first few years in its life, some covered by the warranty period but also a few years past that. It is the customer’s experience of reliability that determine the quality and reliability of the manufacturer and future purchases from that manufacturer. The costs of lost future sales may be even greater than warranty costs, but since is difficult to quantify it may never be known.
Most of the causes of failures are attributable to assignable causes previously mentioned. Traditional reliability engineering is mostly based on FPM and for most electronics design and manufacture companies the majority of reliability engineering resources have been spent on creating probabilistic estimates of the life entitlement of a system and the back end of the bathtub curve. There is little evidence of reducing the costs of unreliability in most electronics products because it occurs in the first several years due to assignable random causes, and not wear out.
A much greater return on investment in developing can be realized when the industry understands that most of the reliability failures in the first few years of use are not intrinsic wear out, but instead on random errors in design and during manufacturing. Reliability engineering must reorient to spend most of the reliability development time and resources to develop better accelerated stress tests, using better reliability discriminators (prognostics) to detect errors and overlook low design margins and eliminate them before market introduction. With this new orientation, electronics companies can be the most effective and quickest at developing a reliability product at market introduction at the lowest costs.
Chet Haibel says
Nice article Kirk. I reacted to the thought that some electronics companies may not be in business long enough as a reason not to worry about obsolescence . We all hope to stay in business.
Fred Schenkelberg says
Hi Chet – thanks for the comment. I think some young companies focus on getting the product out and generating revenue and feedback. They may not have the luxury to fix any issues in today’s market place, yet they might try.
Mark Hollett says
Interesting article Kirk (and a great title). I generally agree with what you say about needing better work up front identifying design and process errors leading to infant mortality failures. This is where we see most of the issues when integrating electronic components into our systems. But not all issues.
You are vastly over-generalizing by saying
Kirk Gray says
Mark, Thanks for your comments. I did not see your complete thought about vastly over-generalizing, but I realize there are always exceptions to any rule. I avoid using the term “all electronics” for that reason and in the article give some long term applications where wear out is a concern and may be a factor. But even with the long term wear out mechanisms that are of concern, getting all the parameters for predictive models correct and accurate for the application can be a significant challenge. Many wear out mechanisms are driven by multiple stresses interacting (i.e. temperature and moisture for corrosion), specific stress life cycle profiles are difficult to obtain, and small variations in model parameters can result in significant errors in predicted life. I have yet to see a reliability prediction that has correlated to the actual field failure rates of electronics systems.
Kari Tikkanen says
Nice article.
I have following hypothesis:
If and when the expected life of the product is only few years the components will be optimized (=less margins) to reduce cost.
When these components are used in long life products (industrial electronics etc.) the result is that the reliability actually decreases despite of “better” components.
When the margins are lower all disturbances in the production process, logistics and applications result to failures that didn’t happen before.
During the past five to ten years we have seen more and more failure cases where the root cause of the failure is component itself. I am not sure of this is because of my hypothesis is correct or if our failure analysis has become better identifying the root cause.
Have anybody seen a trend that some components seem to have higher failure rates than before.
Fred Schenkelberg says
Hi Kari,
Good comment and hypothesis. Unfortunately I don’t have data to evaluate as a test for your idea. Maybe someone in the Linkedin Group ASQ Reliability Division maybe able to supply some hard numbers.
Cheers,
Fred
Doug Plucknette says
Kirk – Interesting article, it would be nice to see some data that supports some of your conclusions. I get the idea of the drain resulting from obsolescence but am not too sure in regard to associating the bath tub curve to electronic components other than the older limit switches, push buttons and relays. I believe what some would see as wear out of today’s electronic components is in truth exposure to competing factors, the enemies of electricity, dirt, dust, water, heat, shock, vibration, sun and so on. Keep the enemies of electricity away and these components have an unknown life. For example, I have a TV that is 20 years old, it works great, and a transistor radio that is 40 years old (it sounds as bad today as it did when I was 10). No sign of the bathtub curve on these but in all fairness I don’t use them everyday.
Fred and Keri,
The Reliability Analysis Center that used to be part of Rome Airforce Base in NY used to have all kinds of data on electronic components of all types. I know at one time or another I had some of that information in my hands, likely in a old laptop that went down Kirks drain!
Good article and conversation as well!
Kirk Gray says
Doug, thank you for your comments.
I dream that companies would allow more publication of the root causes of their electronics failures and distributions, but alas that will not happen (for the reasons see my other post http://nomtbf.com/2012/08/no-time-no-rights-equals-little-advancement/ ). I draw my knowledge of my conclusions from my 12 years of seeing real field reliability issues during 13 years of reliability consulting and my years as a Senior Reliability Engineer at Dell. I wish I could share it, but as you know NDA’s prevent disclosure of warranty data.
I agree with your other comments on old electronics, I have many myself still working but way obsolete (anyone need a dual cassette tape deck?).
Best Regards…and happy 2014!
Kirk Gray
Augustin Cathignol says
Dear Kirk, Fred and all contributors and readers,
Thanks you all for your posts that I’m always pleased to go through.
In several of the posts that we can find on the noMTBF website, it is mentioned that the main limitation in the use of probabilistic statistical predictions based on physical of failure is the is the lack of failure data. For example in “No Evidence of Correlation: Field failures and Traditional Reliability Engineering”, you mentioned “Much of the slow change in the industry is due to the fact that electronics reliability engineering has a fundamental “knowledge distribution” problem in that real field failure data, and the root causes of those failures can never be shared with the larger reliability engineering community. Reliability data is some of the most confidential sensitive data a manufacturer”).In this post present post you write“Precise data on rates and costs of product failures is not easily found, as reliability data is very confidential ”.
I fully share this observation on its consequences of what we can (or rather cannot) expect for such probabilistic statistical predictions based on physical of failure.
And this is the reason why I would like to mention the FIDES reliability methodolog and guide. I must confess that I was surprised no to hit any post while searching “FIDES” in the whole web site. Indeed, the use of FIDES is growing significantly and will probably accelerate as soon as it becomes an international standard.
It’s not only used in Europe but also American or Japanese companies started to use it, such à Boeing and JAXA (Japan Aerospace Exploration Agency) for instance.
FIDES guide and methodology is based on the physics of failures AND SUPPORTED BY THE ANALYSIS OF A HUGE SET OF FAILURES DATA coming of many years, various equipments and used in various mission profiles, coming from major European space and defense compagnies that decided to take part into this project.
The first aim of the FIDES project was to develop a new reliability assessment method for electronic components which takes into consideration COTS (commercial off-the-shelf) and specific parts and the new technologies. The global aim is to find a replacement to the worldwide reference MIL-HDBK-217F, which everybody agreed to be obsolete and very pessimistic for COTS components which are more and more widely used in military and aerospace systems.
It seems to me the the FIDES guide allows getting rid of the main limitation that is lack of available failures data needed to adjust, improve and validate the existing physics-based model.
In addition to taking into account the physics of intrinsic failure, FIDES also relies on the processus used in the development, conception, manufacturing, deployment etc. A the end it results on models failures that reflect both intrinsic causes (item technology or manufacturing and distribution quality) and extrinsic causes (equipment specification and design, selection of the procurement route, equipment production and integration) to the items studied.
You can find more on http://www.fides-reliability.org/?q=en
FIDES is open-access.
I’m not yet a user, nor a specialist of FIDES guide but quite seduced in this inovative relaibility approach.
Looking forwards to reading your thought or feedbacks on FIDES approach,
Cheers,
Augustin
Kirk Gray says
Thanks Augustin for your comments.
I have seen the many failures and causes of failure from many client companies over many years and I have not seen intrinsic wear out of components or systems as a significant contributor to field failures, hence the point of this article. The causes of most failures occur due to errors in design or manufacturing and wear out failures do not contribute significantly because of the relative short time to technological obsolescence. Calculations of degradation and failure are based on intrinsic models of known degradation mechanisms, and do not and cannot include the many assignable causes of manufacturing excursions or combinations of factors that lead to early life (~within 5 years) failures. Reliability of electronics systems without moving parts cannot be predicted. Please download, read and widely distribute to those that still believe in predictions the excellent recent RAMS paper (in the public domain) titled “Reliability Prediction-Continuing Reliance on a Misleading Approach” which can be downloaded here http://www.acceleratedreliabilitysolutions.com/images/Reliability_Predictions_Continued_Reliance_on_a_Misleading_Approach.pdf
C.B. Katzko says
Although we often make the general assumption obsolescence is the saving grace of consumer electronics and commodity computing, I think there are two counter-trends that will promote longer use of some of these products in future.
One trend is cloud computing and the narrow-purpose “generic” servers increasingly used by service providers. As this hardware standardizes, the economic incentive will be to use it as long as practical with module replacements driven more my field failures than microprocessor iterations, and indeed, these systems have been designed with exactly that in mind. So, just as with other “utilities”, service life, reliability and cost of repair/replacement may become dominant. Ditto for NUCs and the like in corporate use.
Another trend is driven the standardization of power and wireless infrastructure for mobile devices. Historically this has also gone the route of commoditization and short life spans, but if standards succeed, again the useful lifespan will increase. However, in this case, we might expect a model similar to commodity desktop PCs, seldom serviced or upgraded unless they fail, and used as long as possible to avoid spending money.
Thus, designers of these systems need to reconsider the reliability needed (some are).
Fred Schenkelberg says
Thanks for the comment – two very good points. I would add the third of environmentally conscience consumers using equipment as long as possible to avoid landfills, etc.
Cheers,
Fred
Mike Sparks says
Hi,
I’d agree that it is very difficult to find published data on the reliability or failure rate of electronics. There is data measured against the TL9000 standard that’s made available to its members by Quest Forum. This includes returns rates and while this isn’t reliability data (returns can be for lots of causes other than a faulty product) it might be of some use. Has anyone tried this?
Regards
Mike
Kirk Gray says
Hi Mike, thanks for your comments. A very big problem with counting returns as failures is that for most electronics producers the verified failures are as little as 10% or less of the warranty returns. So the actual number of failures is very hard to derive from return rates.
Regards,
Kirk
David says
What is the application of the bathtub curve in product design and the provision of warranties.
Fred Schenkelberg says
The distribution of time to failures whether early failures or wear out provide useful information for use in design decisions and/or planning for spares/replacements under warranty. Knowing the expected number of failures is key along with the patter over time.
Cheers,
Fred
David says
Thank you very much Fred. That helps a lot
Website says
I have been exploring for a little for any high-quality articles
or blog posts on this sort of house . Exploring in Yahoo I eventually stumbled upon this site.
Reading this information So i’m glad to express that I have a very excellent uncanny feeling I found out exactly what I needed.
I such a lot undoubtedly will make sure to do not omit this
web site and provides it a glance regularly.
mẫu tủ thờ phật đẹp says
I’m impressed, I must say. Seldom do I come across a blog
that’s both educative and engaging, and without a doubt, you have hit the nail
on the head. The issue is something that not enough folks are speaking intelligently about.
I’m very happy I found this during my hunt for something relating to
this.
Maybelle says
It is really a great and useful piece of information. I am happy that
you simply shared this helpful information with us. Please stay us informed like this.
Thank you for sharing.