How To Evaluate The Reliability Of A System Or Process
60% of failures and safety issues can be prevented by ensuring there is a robust equipment design and that Maintenance & Reliability is taken into account during the design phase. Equipment should be designed with the following in mind:
- Designed for Fault Tolerance
- Designed to Fail Safely
- Designed with early warning of the failure to the user
- Designed with a built-in diagnostic system to identify fault location
- Designed to eliminate all or critical failure modes cost effectively, if possible.
To ensure that the equipment design is capable or yielding our requirements an analysis needs to be performed on the design to ensure the system or process can deliver. There is much different analysis available to perform the analysis, but a relatively simple and widely accepted approach is the Reliability Block Diagram.
Reliability Block Diagram
The Reliability Block Diagram (RBD) is used to identify potential areas of poor reliability and where improvements can be made to lower the failure rates for the equipment. This method can be used in both the design and operational phase to identify poor reliability and provide targeted improvements.
The RBD shows the logical connections of components within a piece of equipment. It is not necessarily the schematic diagram of the equipment, but the functional components of the system. The equipment is made up of multiple components/systems in series, parallel and a combination of the two. These components/systems and configuration of them provides us with the inherent reliability of the equipment. The RBD analysis consists of reducing the system to simple series and parallel blocks which can be analyzed using the appropriate Reliability formula. Reliability typically utilizes three main formulas;
- Reliability;Reliability(Mission Time) = e-λt
λ (lambda) = Failure rate = 1/MTBF
t = mission time in cycles, hours, miles, etc.
e = natural logarithm = 2.71828 - Reliability(System) = R1 x R2 x R3 x R4 x ….RN
- Reliability(Active Redundant Parallel System) = 1 – (1 – R1)(1 – R2)
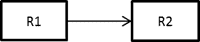
Now that the Reliability formulas are understood, the RBD can be built. A simple series RBD is shown as;
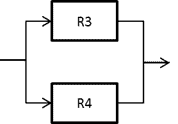
A simple parallel RBD is shown as;
When analyzing a parallel system in the RBD, the operating context of the parallel system must be understood; is the parallel system an active redundant system or are all or a portion of the parallel branches are required to operate the equipment?
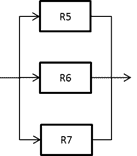
In the above example R5, R6 & R7 are all active redundant branches, so the equipment only needs 1 of the three branches to operate and meet its required performance.
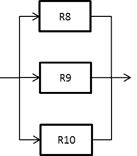
In the opposite example, we have a system that requires 2 out of the three branches to operate at any given time. This means that R8 & R9, R8 & R10, or R9 & R10 must be in working order meets its required performance.
There are a few different Reliability calculations for the system that requires x amount of y parallel branches to operate, and they are in the table below.
| x number of branches out of y | Reliability Equation |
| 1 out of 2 2 out of 2 |
1-(1-R)2 R2 |
| 1 out of 3 2 out of 3 3 out of 3 |
1-(1-R)3 R3 + 3 R2 (1-R) R3 |
| 1 out of 4 2 out of 4 3 out of 4 4 out of 4 |
1-(1-R)4 R4 + 4 R3 (1-R) + 6 R2 (1-R)2 R4 + 4 R3 (1-R) R4 |
Calculating Reliability of a System
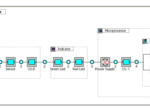
In this example, a pumping system is required to provide a reliability of 90%. The pumping system (simplified for explanation purposes) could be broken into an RBD and shown as;
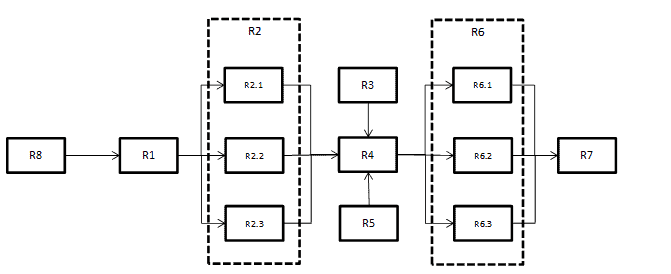
The Blocks reflect the various systems in the equipment;
- R1 = Inlet control valve
- R2 = Motors (R2.1 = Motor 1, R2.2 = Motor 2, R2.3 = Motor 3) (This requires all 3 of the parallel branches to operate)
- R3 = Fluid Supply
- R4 = Distribution Manifold
- R5 = Tank Level Sensor
- R6 = Pumps (these are all required to operate the asset and is therefore not a redundant system)
- R7 = Discharge Control Valve
- R8 = Control System
Once the RBD has been developed, we then need to determine the Reliability of each block and the overall system. We will use the pumping system as our example;
Using the Reliability formula and either the vendor’s data and the history of like assets, the reliability must be calculated for each of the individual blocks and populate them with the reliability value.
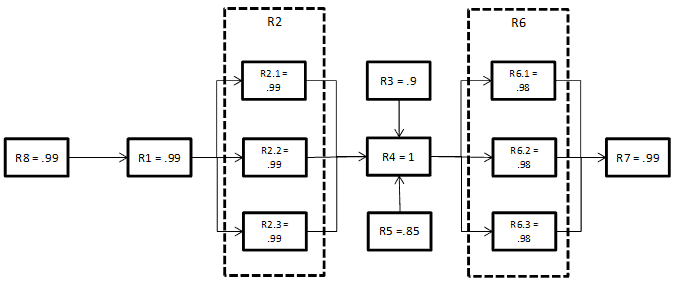
Next, the reliability of R2 is calculated. Since it requires all three systems to operate a simple parallel formula would be used;
- R2 = R 3
- R2 = (.99)3
- R2 = .97
Next the same is done for R6
- R6 = R3
- R6 = (.98)3
- R6 = .94
Lastly, since R4 is dependent on R3 & R5 it should treat it as a series system.
- R = R3 x R4 x R5
- R = .9 x 1 x .85
- R = .76
Next, the RBD can be simplified to a simple series system;
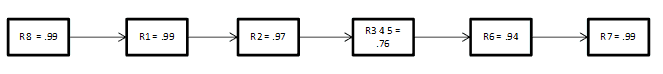
R = R8 x R1 x R2 x R345 x R6 x R7
R = .99 x .99 x .97 x .76 x .94 x .99
R = .67
In the calculation, it can be observed that the pumping system with a Reliability of 0.67 will not meet our needs. What can be observed is that R345 is the lowest point of Reliability so improvements in the design should be directed there. If the design was changed for R345 and reliability brought up to .99, the pumping system would still fall short of the required reliability at .88, so design team must look for additional blocks for improvements and also how the system is arranged and possibly introduce active redundant systems.
Are You Using Reliability Block Diagrams?
How many of you are using RBDs in your design or improvement process? What benefits have you found in using them? For those not using RBDs, what is preventing you from using them?
In the next post, RBD will be discussed in additional detail, discussing the Markov Method, Network Models and a practical example of them.
Remember, to find success; you must first solve the problem, then achieve the implementation of the solution, and finally sustain winning results.
I’m James Kovacevic
Eruditio, LLC
Where Education Meets Application
References
Hi James, Maybe you could check out my article “Dual ring network reliability”. I’m looking for any reference to prior publication of the analytical solution I provide. By the way, RBD don’t help with the solution. Best regards, Les