Accendo Reliability

Your Reliability Engineering Professional Development Site

  • Home
  • About
    • Contributors
  • Reliability.fm
    • Speaking Of Reliability
    • Rooted in Reliability: The Plant Performance Podcast
    • Quality during Design
    • Way of the Quality Warrior
    • Critical Talks
    • Dare to Know
    • Maintenance Disrupted
    • Metal Conversations
    • The Leadership Connection
    • Practical Reliability Podcast
    • Reliability Matters
    • Reliability it Matters
    • Maintenance Mavericks Podcast
    • Women in Maintenance
    • Accendo Reliability Webinar Series
  • Articles
    • CRE Preparation Notes
    • on Leadership & Career
      • Advanced Engineering Culture
      • Engineering Leadership
      • Managing in the 2000s
      • Product Development and Process Improvement
    • on Maintenance Reliability
      • Aasan Asset Management
      • AI & Predictive Maintenance
      • Asset Management in the Mining Industry
      • CMMS and Reliability
      • Conscious Asset
      • EAM & CMMS
      • Everyday RCM
      • History of Maintenance Management
      • Life Cycle Asset Management
      • Maintenance and Reliability
      • Maintenance Management
      • Plant Maintenance
      • Process Plant Reliability Engineering
      • ReliabilityXperience
      • RCM Blitz®
      • Rob’s Reliability Project
      • The Intelligent Transformer Blog
      • The People Side of Maintenance
      • The Reliability Mindset
    • on Product Reliability
      • Accelerated Reliability
      • Achieving the Benefits of Reliability
      • Apex Ridge
      • Metals Engineering and Product Reliability
      • Musings on Reliability and Maintenance Topics
      • Product Validation
      • Reliability Engineering Insights
      • Reliability in Emerging Technology
    • on Risk & Safety
      • CERM® Risk Insights
      • Equipment Risk and Reliability in Downhole Applications
      • Operational Risk Process Safety
    • on Systems Thinking
      • Communicating with FINESSE
      • The RCA
    • on Tools & Techniques
      • Big Data & Analytics
      • Experimental Design for NPD
      • Innovative Thinking in Reliability and Durability
      • Inside and Beyond HALT
      • Inside FMEA
      • Integral Concepts
      • Learning from Failures
      • Progress in Field Reliability?
      • R for Engineering
      • Reliability Engineering Using Python
      • Reliability Reflections
      • Testing 1 2 3
      • The Manufacturing Academy
  • eBooks
  • Resources
    • Accendo Authors
    • FMEA Resources
    • Feed Forward Publications
    • Openings
    • Books
    • Webinars
    • Journals
    • Higher Education
    • Podcasts
  • Courses
    • 14 Ways to Acquire Reliability Engineering Knowledge
    • Reliability Analysis Methods online course
    • Measurement System Assessment
    • SPC-Process Capability Course
    • Design of Experiments
    • Foundations of RCM online course
    • Quality during Design Journey
    • Reliability Engineering Statistics
    • Quality Engineering Statistics
    • An Introduction to Reliability Engineering
    • Reliability Engineering for Heavy Industry
    • An Introduction to Quality Engineering
    • Process Capability Analysis course
    • Root Cause Analysis and the 8D Corrective Action Process course
    • Return on Investment online course
    • CRE Preparation Online Course
    • Quondam Courses
  • Webinars
    • Upcoming Live Events
  • Calendar
    • Call for Papers Listing
    • Upcoming Webinars
    • Webinar Calendar
  • Login
    • Member Home

by Fred Schenkelberg Leave a Comment

Using rain-flow counting methods for process wear out studies

Using rain-flow counting methods for process wear out studies

Guest Post Prepared by Eugene Danneman, Wind Wear LLC

Introduction

Analyzing and visualizing data that is related to equipment wear-out (fatigue stage) over a specific time span is a challenge. Analyzing systems, equipment and components exposed to spectrum loading as opposed to uniform cyclical loading that span years or decades or centuries requires a special approach. Think of roads, bridges and other assets with long life spans that are susceptible to wear out mechanisms caused by external and internal loads, varying load durations, temperature swings and corrosion.

For complex processes that consist of many pieces of equipment and components, it is often useful to take time history data and convert it to a count of the tensile and compressive cycles that equipment was exposed to. That data may be mechanical, thermal, electrical, chemical or some combination of forces that cause the irreversible degradation of the component material being studied. Historical throughput or production data is often the easiest to gather and analyze for “40,000 foot” cycling studies where one significant digit and one order of magnitude accuracy is adequate.

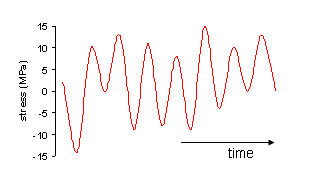
The rain-flow-counting algorithm (also known as the “rain-flow counting method”) is used in the analysis of fatigue data in order to reduce a spectrum of varying stresses into a set of simple stress reversals.1

Rainflow_fig2

The fatigue phase of a product’s life cycle bath tube curve is characterized by an increasing failure rate.2

Bathtub curve plot

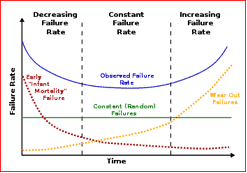
When we understand the physics of failure(s) caused by cycling forces, the wear out phase can often be postponed using effective predictive and preventative maintenance methods.

Delaying wear-out failures increases useful life; avoids or mitigates catastrophic events and reduces process production costs.

The American Society of Testing and Materials Standard ASTM E 1049-85 “Standard Practices for cycle counting in fatigue analysis” has many cycle-counting algorithms. One of them is the rainflow cycling counting algorithm created by Downing and Socie.

There are many software solutions using rainflow counting algorithms available for your use. I have been using the StoFlo freeware rainflow cycle counting Excel template.4

Example

The following example uses production data for a conventional thermal power plant with a design maximum output of 767 Megawatts/hour that was in continuous production for the study period of 365 days (8,760 hourly data points).

The raw data for this example starts with hourly production data (00:00:00 hour = 771.47 Megawatts) which is loaded into the StoFlo rainflow cycle counting Excel template. Table 1 show the format used.

Table 1 -Data format (Hour and Stress Value – Megawatts)

00:00:00 771.47
01:00:00 759.72
02:00:00 744.47
03:00:00 627.38
04:00:00 610.74
05:00:00 527.55
06:00:00 651.00
07:00:00 712.61
08:00:00 774.15

The output of the StoFlo cycle counting produces an analysis output (Table 2) showing the range of each hourly cycle and the average production load for each “rainflow” count.

Table 2 – Range and Mean rainflow cycle count for XYZ Power Plant

Rainflow cycle count

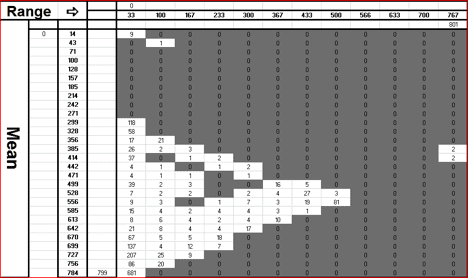
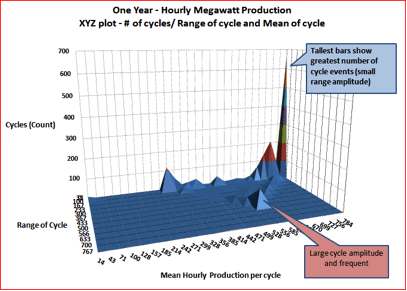
Table 2 is converted to a Excel software 3D graph with the cycle counts on the Y vertical axis, range of cycle on the Z axis and the average hourly production per cycle shown on the X axis.

1yr production - 3d

Observations

  1. The tallest bar of the 3D plot is located in the right rear (over 650 cycles between a load of 756 and 784.
  2. An unusual pattern is shown at about 525 Megawatt with a production swing of ~500 Megawatts in one hour for about 50 cycles in this one year study period. Further study is needed to understand the magnitude of damage that could be occurring from changes in temperature, pressure, external forces and/or corrosion mechanisms at the component level.

This simple analysis approach provides the starting point to drill deeper where cycling related forces could be causing irreversible damage. It provides a graph that is easy to understand.

Caution

Rain flow counting methods involve the assumptions that the tensile and compressive loads are independent and the order of loading does not matter. These assumptions may affect the validity of using this method. This simplified approach of using production data is inadequate for determining component end of life. It is useful as a high level method in identifying areas for further study and for analyzing cycling pattern changes of an asset year to year, decade to decade or century to century.

Footnotes

Rainflow – counting algorithm – Wikipedia https://en.wikipedia.org/wiki/Rainflow-counting_algorithm

The Certified Reliability Handbook Second Edition by Donald W. Benbow and Hugh W. Broome – page 26

https://en.wikipedia.org/wiki/Bathtub_curve

http://www.stotera.com/stoflo/

Filed Under: Articles, Musings on Reliability and Maintenance Topics, on Product Reliability Tagged With: data analysis, Fatigue, Production Data

About Fred Schenkelberg

I am the reliability expert at FMS Reliability, a reliability engineering and management consulting firm I founded in 2004. I left Hewlett Packard (HP)’s Reliability Team, where I helped create a culture of reliability across the corporation, to assist other organizations.

« 10 Things A Reliability Engineer Can Do Today To Improve Reliability
Leading & Lagging KPIs, What Is The Difference? »

Leave a Reply Cancel reply

Your email address will not be published. Required fields are marked *

Article by Fred Schenkelberg
in the Musings series

Join Accendo

Receive information and updates about articles and many other resources offered by Accendo Reliability by becoming a member.

It’s free and only takes a minute.

Join Today

Recent Articles

  • test
  • test
  • test
  • Your Most Important Business Equation
  • Your Suppliers Can Be a Risk to Your Project

© 2025 FMS Reliability · Privacy Policy · Terms of Service · Cookies Policy