
Vehicle Warranty Big Data
Automobile companies pay dealers to perform vehicle prep and make warranty repairs on customer vehicles. A lot of data is collected thus warranty is considered big data.
Generally, vehicle warranty covers 3 years or 36,000 miles. When a vehicle is serviced, the customer, vehicle, repair, and text data are collected. Claims are entered into a transaction database, may be rejected for a number of reasons, and then resubmitted until resolved. The transaction database covers many model years, millions of vehicles, and a number of warranty claims for each vehicle. As a rough estimate, assuming 10 years, 2 million vehicles/year, and 2 claims for each vehicle, yields 40 million records. The actual number is higher due to the submission, rejections, and resubmission cycle.
Primary Warranty Data Usage
Routine warranty studies are used to identify high cost and high failure rate components, systems, and software needing improvement. These investigations are repeated for the total production and many subsets including individual vehicle lines, assembly plants, … Many departments are devoted to maintaining the database, to identifying problems, to extrapolating trends, and looking for improvements.
Customer Usage Metrics
While the focus in on identifying problems, the warranty may be used to refine high-level vehicle usage metrics. A top-level metric is the rate of mileage accumulation of the fleet or types of vehicles. This metric is used to define validation targets to verify components, systems, and vehicles meet business objectives of low cost and low failure rates.
For the rate calculations, the mileage, the service date, and the sold date are required. The mileages and service dates come from the claims database. The sold dates come from a sales database. From the date information, the number of days in service is calculated as the difference between the service date and the sold date. For this example, the rate is the miles per month and each month is assumed to be 30 days. For each claim, the equation used to calculate the rate per month is easy, using formula 1.
$$ \large\displaystyle R=\frac{30*M}{D} $$
(1)
Where R is the calculated mileage accumulation rate, M is the vehicle mileage at warranty service, and D is the number of calendar days the vehicle has been in service. A unique value is calculated for each vehicle.
Errors and Filtering
Most of the time, the rate follows a steady trend, but some anomalies occur. For instance, on a date where the vehicle was serviced, the odometer was expected to be about 30,000 miles. Instead, the odometer was recorded as 230,000 miles. At the next warranty service, the odometer returned to the trend line. This was obviously a data entry error. Other types of errors are possible, are difficult to detect, and contribute to variation around the odometer vs. date trend line.
Abnormal vehicle usage is another source of error. For example, a new vehicle may be used more frequently than an old vehicle. Why? Perhaps the owners are proud of their new vehicle. Alternatively, the operators prefer to use the inherently more reliable new vehicle. For whatever reason, the new vehicle miles/month is higher than the lifetime value desired.
Filtering the raw data can remove some of these errors. The claims should be filtered to the warranty coverage, avoiding the obvious data entry errors. For immature vehicles, it was reasonable to ignore claims that had less than 30 days in service and less than 300 miles of total usage.
Analysis Alternatives
After filtering, the highest mileage and maximum service date for each vehicle were used to calculate the maximum days in service. This provides an average mileage accumulation rate for each vehicle.
Some software logic would be required to handle cases where there were only 1, 2, … claims. A single-vehicle warranty claim does not provide much information. Two warranty claims will provide the slope of the regression line. Three or more provide the opportunity to look for deviations from the trend.
Results
If one calculated the average, the standard deviation, and applied the normal distribution, then erroneous projections and extrapolations result. Consider a vehicle type that had an average of 1297 miles/month and standard deviation of 617 miles/month.
Some studies show the mileage accumulation rate follows a lognormal distribution. My studies showd that the lognormal fit the vehicle data with about a 98% correlation while the normal fit the data with about an 89% correlation. The Weibull distribution was considered but showed a slightly lower correlation of about 96%.
Assuming the lognormal is the best, the analysis results were very different than a normal distribution. A comparison of the normal and the lognormal probability density is shown in figure 1.
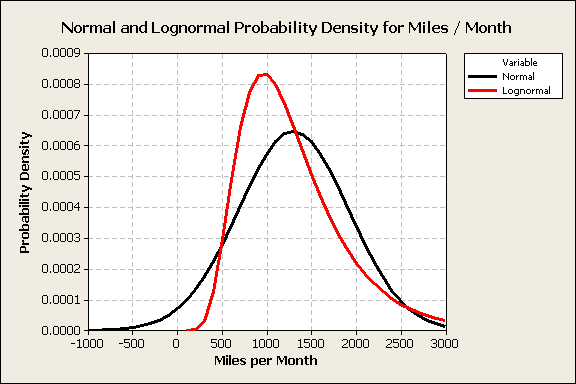
Figure 1
Consider the normal distribution plot. The vehicles with negative mileage accumulation rates are predicted. Below 500 miles/month, the normal predicts too many vehicles. Above 2,600 miles/month, the normal predicts too few vehicles.
The lognormal distribution provides more realistic results. It is skewed to the right to include vehicles with very high usage and avoids negative predictions.
The cumulative probability distribution shows a similar story.
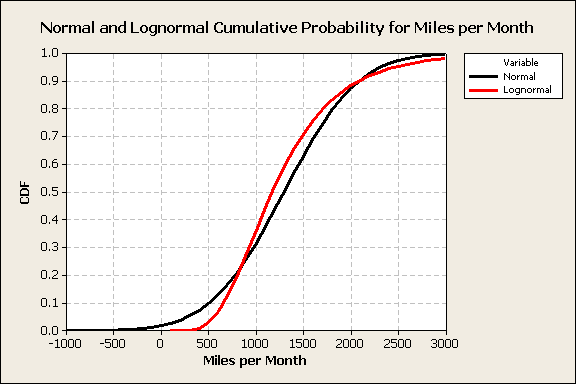
Figure 2
Using the normal distribution, 1.8% of the vehicle population was projected to have negative mileage accumulation rates. This is physically impossible.
Let’s compare the population percentiles predictions using the lognormal and the normal distributions.
| Population Cumulative Percentile |
Normal |
Lognormal |
|
1% |
-138 |
411 |
|
5% |
282 |
559 |
|
50% |
1,297 |
1,171 |
|
95% |
2,312 |
2,456 |
|
99% |
2,732 |
3,337 |
Table 1
Because the data is not normal, the best metric of centrality is the 50th percentile or 1,171 miles/month, not 1,297 miles/month. If the company targets a 99th percentile usage, then the target should be 3,337 miles/month, not 2,732 miles/month.
Conclusions
Warranty is Big Data that can be processed to provide detailed information on a component, system, and vehicle failure rates and cost. Statistical views of top-level metrics focused on market segments can be developed.
Frequently, an analyst will use the normal distribution. A valid statistical analysis requires that one used the best-fit data distribution. In the case of vehicle mileage accumulation rates, the lognormal should be used.
Leave a Reply