
Weibull analysis is a tool that is used for characterizing the behavior of a data set. The value of characterizing a data set is being able to make predictions of failure rate for the same or a similar population. Input to the Weibull analysis is time to fail for all failed units and running time for operating units. The assumptions for the data set are critical to ensuring the right information is included in the analysis. This may include root cause analysis of the failures so they can be characterized as wear-out or use stress related. It would be beneficial to separate these two data sets because their characterization and behavior will be quite different Weibull factors.
Weibull is very dynamic and can actually correctly represent other distributions like Normal, Lognormal, and Exponential. Weibull analysis will produce a characterization of a data set with values for variables such as the “shape paramater”, “scale parameter”, and “location parameter”. 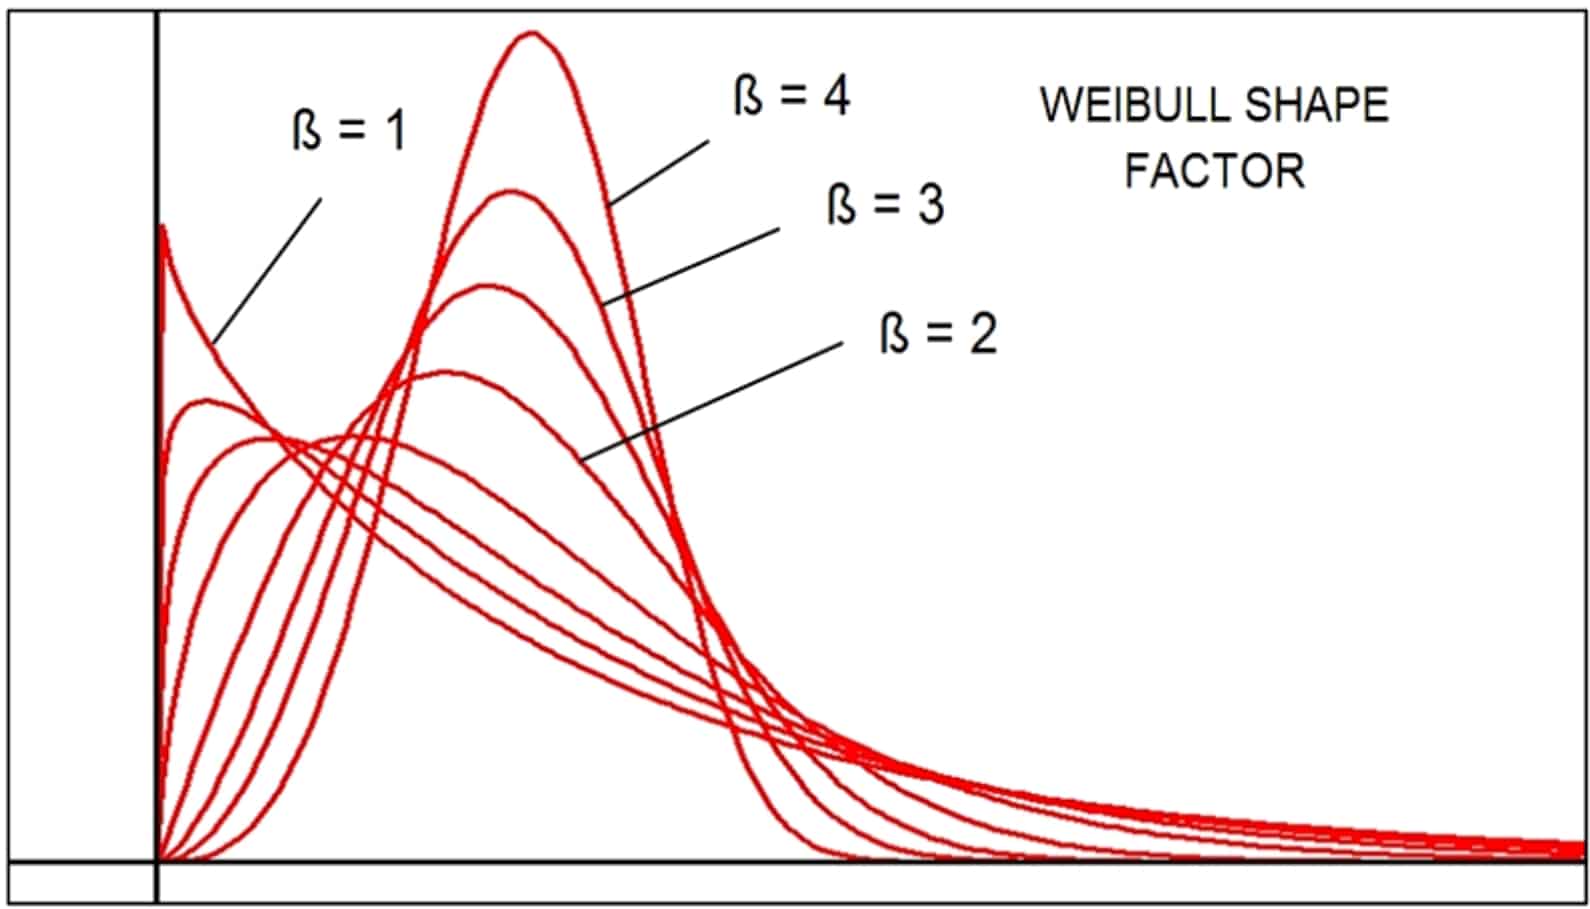 Using these values in the Weibull equation will permit predicting the failure rate for the population at future points in time. This is a very powerful tool to have when making program decisions as I will show later. Let’s take this concept of predicting behavior by characterization to simpler terms we are familiar with to better understand how it works. The simplest version of this type of data analysis was something we all did in grade school. We have two points on a graph. If we assume these two points are a part of a line we can predict where the other points of the line will be once we characterize the data set. In this case all we need to characterize is the slope and the point of intersection with the Y axis. The equation is “y=mx+b”. “x” and “y” are the coordinates for any given point on the line. “m” is the slope of the line and “b” is the “y” intercept. You are then free to put in any other value of “x” or “y” and calculate the reciprocating coordinate value. If the “x axis” was time you could calculate the value of “y” at any future point in time.
The next level of complexity for this method may be characterizing a data set that makes an arc. This is commonly characterized with the equation (x-h)2+(y-k)2=r2. The center of the arc is ”(h,k)”, “x” and “y” are the coordinates of any point on the arc, “r” is 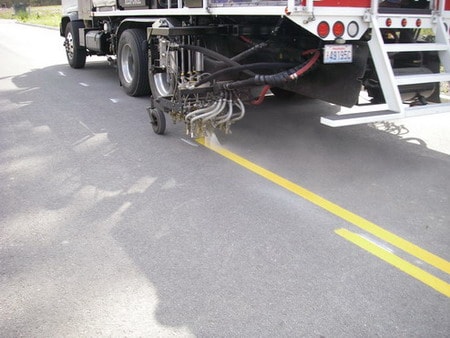 the radius. You are watching a road line painting machine, the driver fell asleep (boring job), the speed was set, and he slumped over and turned the steering wheel a bit. You are far away and want to know what point to run to so you can stop it. I have no idea why any of this would happen but it’s what came to mind when I was thinking of a reason you would want to predict an arc. By taking points on the arc that were already painted you could calculate the radius and center point of the path of travel. Using the arc equation calculate the point the machine will be at when you can get to it. You saved the day? Not really, it would have been smarter to just let it play out, hit record, and put it on Youtube. Take all of this to the next level of complexity with polynomials, “y=k(x-3)(x-1)(x+2)” . This is important to include in this overview because now we are predicting with a population that will change behavior over different periods of time.
A POLYNOMIAL IN ACTION
Weibull is just the next step in complexity for this analysis method. It is powerful and so commonly used because it is very dynamic. For an analyst, it can be a slow process of calculating “goodness of fit” of a data set to a defined distribution. “How well does this data set fit to a normal distribution?” “Not that well.” “How about a lognormal distribution?” “Not really.” If we take it to a Weibull distribution it will tell us which distribution it is a close fit and how well it does fit it. This is very powerful and useful when we have a large data set of runtime and failures and want to know what will happen in the future.
“Is this failure rate decreasing and we are past the storm?” “Is this failure rate increasing and the center of the storm is coming up?” This is a critical question to be able to answer when discovering a troubling failure rate in the field. If the failure rate is decreasing at a steep rate then the best course of action is to leave what is out in the field alone and go work on the manufacturing quality process that is producing defective units. The units out there are the ones without the defect. Replacing them is a mistake because you are likely taking a unit that has proven it doesn’t have an issue and replacing it with a new one that may have the defect.
If we project an increasing failure rate we need to pre-emptively replace every unit we can in the field. They are ticking time bombs. This preemptive action changes the result from a high field failure rate to just a minor annoyance and expense of an unexpected but scheduled, field maintenance. Weibull to the people!
-Adam
Great document on weibull. But how to calculate Beta function from failures and how to diagnose the type of failure.
Amit,
Great questions. Beta (shape parameter) is calculated by putting the data into the Weibull equation and estimating the best fit for Weibull parameters. Today this is rarely done by hand because there are many software options out there that can do this. Once the calculation provides the factors like Beta projections for the population can be made. To group a failure as an infant mortality, use life, or wear-out requires a thorough and consistent root cause analysis process. This process will be specific to the product being tested and constantly optimized by the reliability team as new behaviors are observed in testing. or instance a root cause analysis might find that a clearance tolerance is the cause of a specific group of failures. The manufacturing process will have to be examined to see if parts are being made out of spec. If not then the design will have to be evaluated for reduction in tolerance sensitivity or increased tolerance requirements. The first is a quality defect (infant mortality) and the second a use life failure driven by design. Feel free to contact me if you would like to discuss it further. abahret@apexridge.com
Regards, Adam