Where MTBF Falls Short
Guest post by Chris Peterson – see her daily blog Test To Be Your Best
I have a brand new widget and I’m very excited about the design. It has features I’ve never built in before, there is a huge market need for it, and now I have to try to prove it’s reliability before I can sell it. What do I use?
Let’s try MTBF. It has been around for over 60 years and is a very common approach.
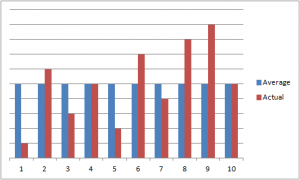
Here is where the possible issues start. MTBF is the calculated average time it will take for a system to fail. If you think about an average, it includes everything from the highest to lowest. If 5 is the average out of 10 you have no clue from that 5 if the majority of the population was close to it or scattered from 1 to 10. An average doesn’t show variability and that could cause issues.
Another issue is that the end use environment is also based on averages yet the world is full of extremes. Say that my widget is going inside of a laptop computer and I decide to use the metric for typical office temperatures. That’s all well and good, but that computer will see much more extreme conditions that that. It might sit on a car seat with the windows rolled up under the blazing desert sun, or be left in a trunk in the dead of winter. People are impatient and want their electronics to work under all conditions and they aren’t going to wait until the laptop reaches typical office temperature before they use it. What will the reliability be then? MTBF can’t give us a clue because even if extremes were considered (which would be rare) they would go into an average (environmental conditions) which is then averaged again (assumption of mean time between failures).
Think now of the bathtub curve with infant mortality. Is the MTBF based on whether the item has been screened to try to detect any items that would fall into that part of the curve? If that screening has been skipped then the average that the MTBF is based on would have the possibility of many items falling short of that.
MTBF is a probability, not a guarantee. It is based on assumptions. Then there is a confidence level on top of that which may be subjective and is an assumption. Then there is averaging instead of a range which leads to another assumption. Therefore we have an assumption (which could be flawed) based on an assumption (which could be subjective) based on an assumption of probability which is an educated guess which we will call engineering judgment.
Do you really want to gamble on a good guess?
So you don’t believe in statistics and probability mathematics? But most physics formulas are based on this mathematics (which is one the most mature area of mathematics) and most engineering formulas are based on physics. Engineers base there work on this mathematics every day. Most of us fly in airplanes that depend on statistics and probability for reliability, maintenance, and safety. Thus betting our lives on this math, not to mention stock brokers, Las Vegas, etc. This is a very complex world that we live in and there are NO ABSOLUTES other than death and taxes :-). You have me very interested in just what is your approach to managing these risks in a quantitative method?
Please understand that I am not saying that MTBF or similar formulas should never be used, but that if they are used that there is a full recognition of what they are. I believe that testing should go hand in hand with any reliability predictions which should add to the confidence level, and that all field failures should be carefully analyzed to see whether it was due to some inherent weakness or due to some form of misuse, abuse or catastrophe. Then the statistical formulas should be reevaluated. Mathematicians have their proofs; testing, along with field data, are the proofs for reliability theories.
What else is there to gamble on? I have seen physics of failure methods described but while they may inform or even feedback into design (in theory) they vary between producers and seem intended for internal consumption.
It is widely acknowledged that MTBF is lacking in many aspects, I was under the impression that it is used as a comparison method between products from different suppliers and regarding MIL-HDBK-217, the intention behind VITA51.1 was to standardize the process so these figures could be compared on a more equal basis. It is useful to compare field reliability with predicted reliability and use one to calibrate the other with a field factor. It seems the underlying bone of contention you have is that everything is based on averages. But that is the basis for everything of any value, even evidence based medicine adopts this approach and yes there will be anecdotal evidence of exceptions, and of course they will exist but statistically more people will benefit from this (statistical) approach. Human nature is to pay more attention to the exceptions than to the trend, this is how the media choose their news content after all.
You will of course have to get the suppliers on board, all their reliability data is based on MTBF, and you will have to get them all to agree to make the same changes.
It seems like an impossible task because it looks like you want to replace MTBF with another metric.
Hi Peter,
Thanks for the comment and information.
My first and primary issue with MTBF is so many do not understand what it is and means. It is the 63rd percentile of failures. And, it tells us nothing about failure rates over the first half of the products life (i.e. over the period when half the product fails.) It is just a point and an infinite number of curves can occur all going through that point creating the same MTBF.
In my experience very few organizations care about the time till over half of the units fail, most wonder about when the first small percent fail. So, what I am suggesting is to use the life distribution with a focus on the periods of time of interest. The distribution can be non-parametric (no averages) or parametric (basic regression statistics) and a simple graph (either a mean cumulative function or cumulative density function plot) generally understandable by (even) mid level managers would suffice to enable better decision making based on the information.
I often think of fans, which used to all report MTBF (seemed all claimed exactly 50k hours MTBF). They know and we know that cooling fans for electronic chassis are most likely to fail due to bearing wear out and failure. So, what am I supposed to do with the MTBF value? Especially if I want to estimate failures over the 1 year warranty period (or stock spares, etc.). The 50k MTBF if used with the exponential distribution significantly over estimates the failure rate of the first year. The bearings are fine and barely worn during the first year, it is only near the end of life for them (maybe 3 to 5 years of useful function before the wear become significant). By overestimating failures, I can buy a more reliable fan to reduce first year failures unnecessarily, stock unneeded spares for a few years, etc. Using MTBF has a real cost due to the mistakes it causes.
Instead if I have the Weibull distribution parameters for the fan’s expected life – and more fan vendors are gathering and reporting these values – I would significantly increase the accuracy of the first year failure rate estimate. I can determine warranty costs, number of spares, etc. and be reasonably close to the right values.
Couple this type of estimating error with errors of understanding, like 50k hr MTBF meaning a failure free period for about 5 years of full time use…. and other misunderstandings which leads me to believe MTBF is our profession’s worst four letter acronym.) I hope you understand why I started this site and continue to talk about it.
I glad you commented and joined the discussion – and the next time you are using MTBF ask if it is actually useful or is there a better way? Then use the better way.
cheers,
Fred
dear Fred,
since a few months I have been assigned as a reliability engineer. I am new to this field of expertise. Mostly I have been studying the Weibull books of Abernethy and Dodson. What I cannot get my head around is the following.
The MTTF can be calculated by means of a Gamma-fucntion ( MTTF=char.life*Gamma(1+1/beta) ) on the Weibull distribution (I hope my english is clear enough). When beta =1 the MTTF is equal to the characteristic life (R=0.368). The general MTBF calculation also suggests that at the MTBF time, R=0.368. Ok fine. Now what I do not get: If I calculate from the gamma-fucntion the MTTF from data with only failures (no suspensions), the MTTF equals the MTBF (total time failures/total failures) while beta is not necesarely 1 in the Gamma-fucntion!!! How can that be when the general MTBF metric suggests that beta =1?
kind regards
Durandus
Hi Durandus,
It appears you have the right formula and approach. I have found that when beta is close to one the mean of the weibull distribution is about the same as the eta (scale parameter). Beta great then 2 or less then 0.5 will show a small change, maybe 10% different or so. The larger the beta is different than 1 the larger the difference between the expected value (mean) and eta (scale parameter).
cheers,
Fred
dear Fred,
thank you for your quick reply. Does that mean that when calculating the MTBF by means of the formula: total operating time/total failures, beta is not per se 1? Why then is there always the statement that R=0.368 at the MTBF (doesn’t make any sense because an R=0.368 states that beta =1 (and it actually isn’t). Shouldn’t we then just leave that common formula on MTBF out of the reliability equation?).
How come there is such a discrepantion between these formulas?
I am just trying to understand it correcty. We already are shifting towards the B-life metric PoF and DOE,
regards
Durandus
Hi Durandu,
I’m not sure I’m following you correctly, yet it might be that you are using an estimate method for the exponential distribution ( theta = Total time / number of failures ) for the eta parameter in the weibull distribution.
Exponential reliability is R(t) = e ^(- t / theta )
while the Weibull reliability function is R(t) = e ^[(- t / theta )^beta]
When beta equals one then the two formulas are the same. If you estimate theta with total time/number of failures you are assming/forcing beta to be one. Instead use the time to failure information direction to estimate the two weibull parameters using weibull plotting paper or a software package.
Cheers,
Fred